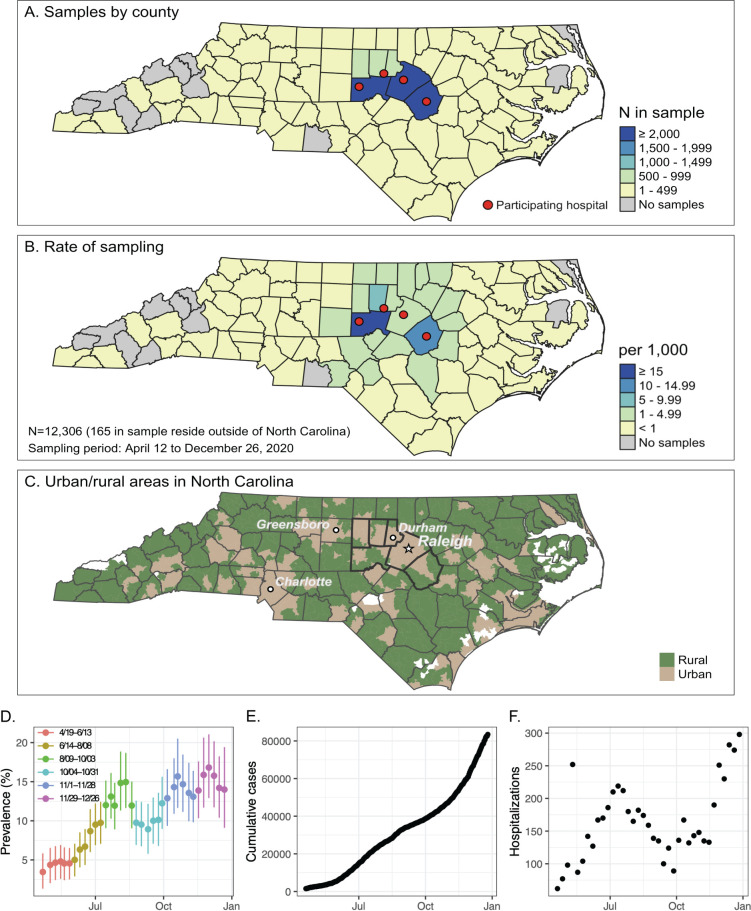
FIG 1.
Catchment area for sample collection and trends in prevalence and cases over the study time period. Remnant samples were collected from hospital clinical laboratories from each of the four sites indicated by the red dots. (A) Number of samples collected by count as well as (B) the rate of sampling. (C and D) North Carolina urban and rural areas displayed for comparison in map (C) as defined by U.S. Census zip code tabulation areas (42). (D) Weekly posterior mean seroprevalence estimates and 95% credible intervals for the study period of 19 April to 26 December of the hospital samples by ELISA plotted over time over the course of the study period. (E) Cumulative daily COVID-19 PCR+ cases from the six-county area from 19 April to 26 December and (F) weekly COVID-19 hospitalizations in the six-county area from 19 April to 26 December from the NC Department of Health and Human Services.

