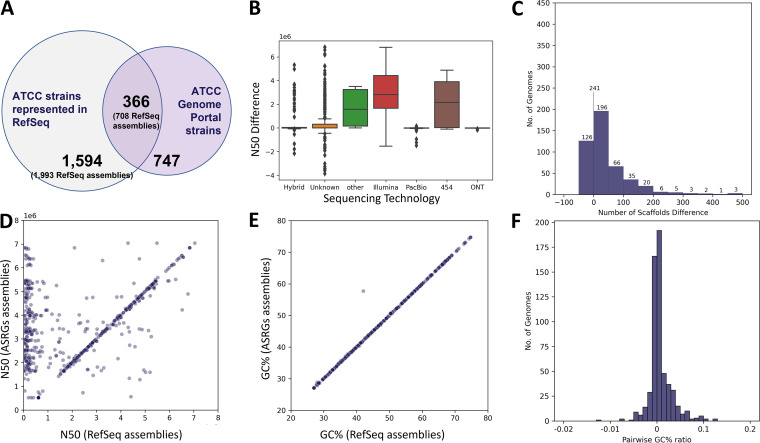
FIG 3.
Comparative metrics for 1,113 ASRGs versus RefSeq Assemblies. (A) Intersection of ASRGs versus RefSeq for strains labeled as being from ATCC. In parentheses are the total numbers of RefSeq assemblies, allowing for strain redundancy. (B) N50 variability of RefSeq versus ASRGs by sequencing technology. Note that the scale is 1E6. (C) Differences in contig counts for ASRG versus RefSeq assemblies. Positive values indicate that the RefSeq assembly had more contigs. (D) Ratios of ASRG N50 values (y axis) to RefSeq N50 values (“public,” x axis). Density along the diagonal indicates that many assemblies are similar, while density along the y axis indicates ASRGs with higher N50 values. (E) GC content for ASRGs (y axis) versus RefSeq (x axis). Nearly all assemblies have less than 0.1% difference in GC content. (F) Pairwise GC content differences between ASRGs and comparable RefSeq assemblies for the same strain.

