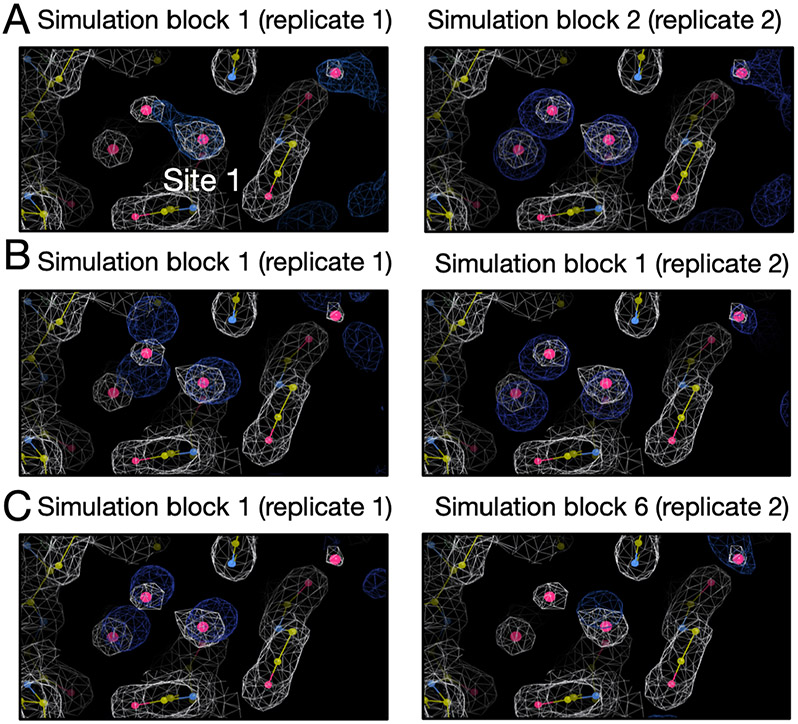
Figure 17:
Calculated electron densities (blue) from simulations compared to the experimental densities (white) of the BTK system (PDB: 4ZLZ). The target site is labeled. We only show the simulation block when we first observe a good agreement between the calculated and experimental density. All simulations can reproduce the experimental electron densities. Panel A, B and C are results from BLUES, grand and MD simulations, respectively. The left and right columns are results from two replicates for each simulation technique. The number of force evaluation for each simulation block is 1.4 million in this analysis.

