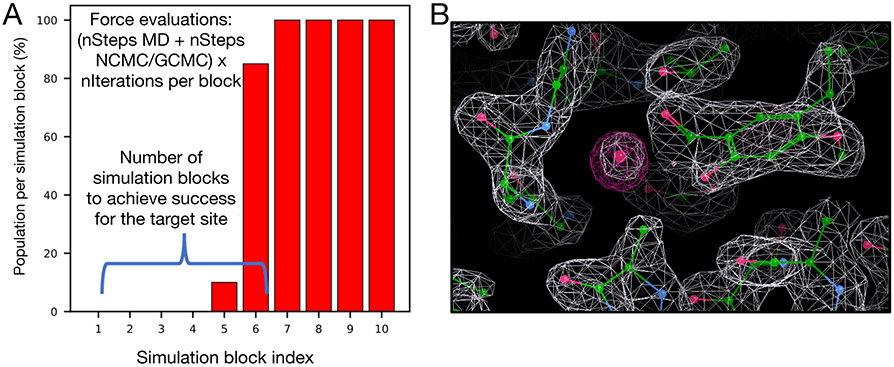
Figure 2:
Examples of water occupancy and electron density maps for success cases. (A) Bar graphs show the water occupancy of a target hydration site in a single simulation. In this case we consider a simulation successful if the occupancy of the target water site is within 5% of 100% in a single simulation block. If successful, we check the force evaluations required to achieve this, including the number of evaluations used in equilibration. (B) The calculated electron density map of water molecules from simulation data (magenta) and the experimental determined density map (2Fo-Fc map) (white).

