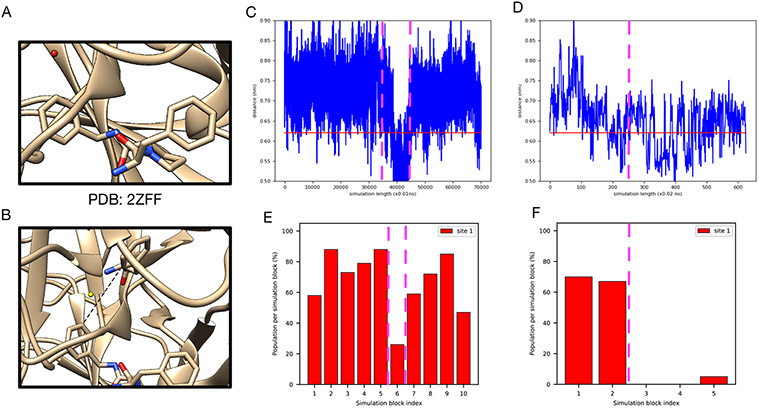
Figure 6:
A correlation between the distance between the protein and ligand and the success of water insertion was observed in (A) the thrombin system (the target water site shown in red). (B) The atoms selected to compute distance between the protein and ligand. The distance change during (C) unbiased MD and (D) grand simulations (no restraints used). Bar graphs show the water occupancy of target hydration site in a single (E) unbiased MD and (F) grand simulation (no restraints used). The horizontal lines in (C) and (D) highlight the distance in the crystal structure (PDB: 2ZFF). The dashed vertical lines highlight the simulation block(s) in (C)-(D) and their corresponding occupancies in (E)-(F).

