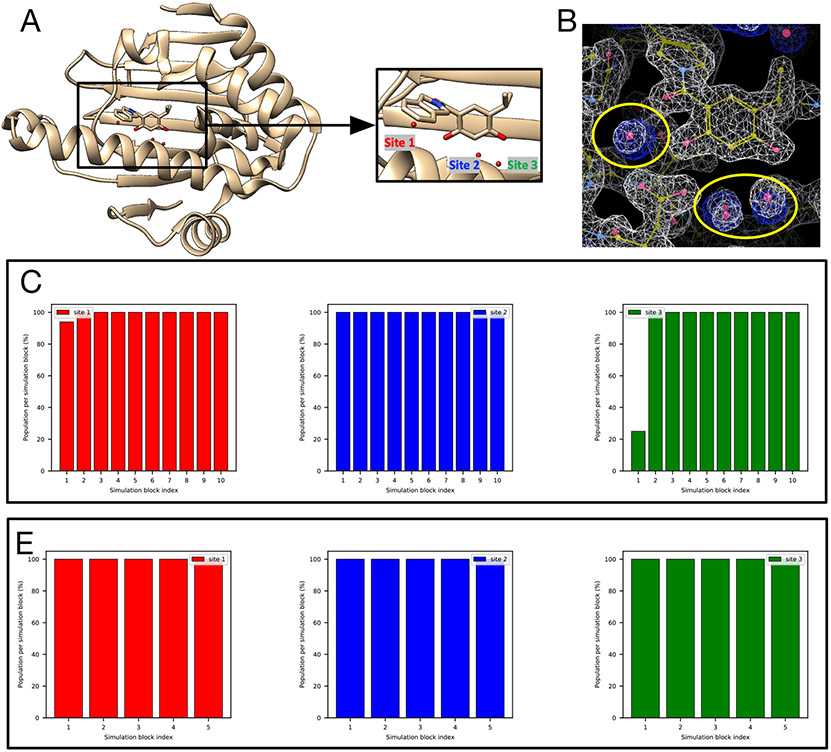
Figure 9:
Both BLUES and grand simulations can rehydrate all three target sites (Site 1: red, Site 2: blue, Site 3: green) in (A) the HSP90 system (PDB: 2XAB). (B) The calculated electron density map (blue) overlaps with the experimental electron density (2Fo – Fc) map (white). The target hydration sites are circled. The calculation is based on a BLUES simulation trajectory where all target sites have occupancies of 100%. Bar graphs show the water occupancy of target sites in a single (C) BLUES simulation, (D) grand simulation.

