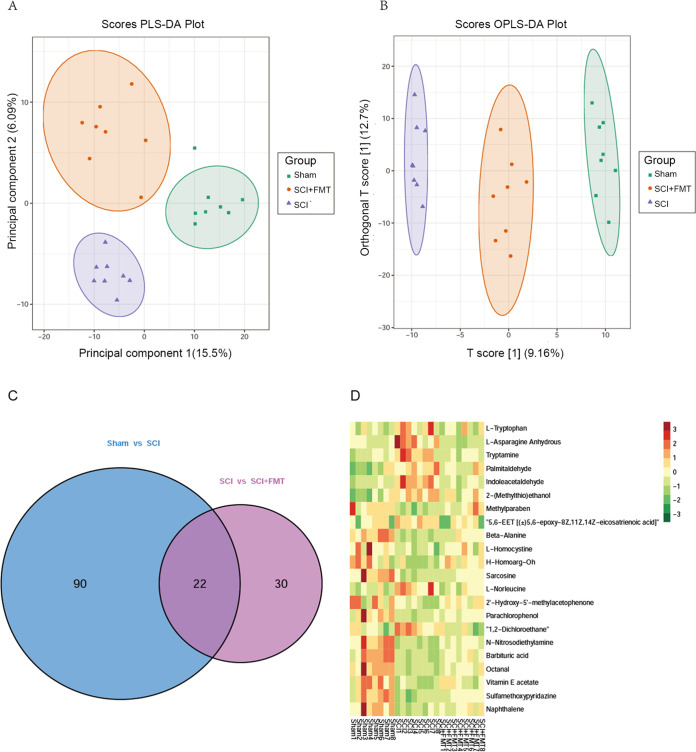
FIG 7.
Differential amounts of metabolites among the sham, SCI and SCI+FMT groups. (A) PLS-DA score plot based on metabolic profiles in fecal samples from the sham, SCI and SCI+FMT groups. (B) Score scatterplot of OPLS-DA revealing the separation among groups according to metabolic differences. (C) Metabolites significantly altered in sham animals versus SCI group and SCI group versus SCI+FMT group. Those with VIP >1.0 and P < 0.05 (t test) were identified. Venn diagrams demonstrating the amounts of altered metabolites shared among the three groups by the overlap (n = 8). (D) Relative amounts of 22 differentially produced metabolites in the three groups, presented as a heat map.

