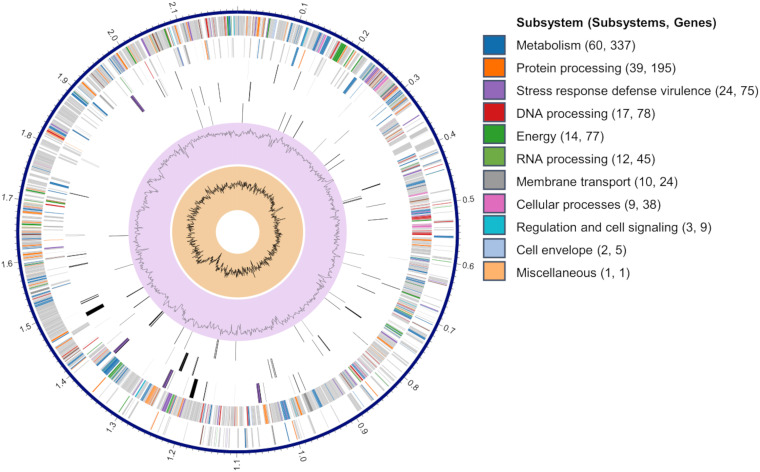
FIG 3.
A circular genomic map of S. oriscaviae HKU75T, showing a circular graphical display of the distribution of S. oriscaviae genome annotations. From outer to inner rings: contigs, CDS on the forward strand, CDS on the reverse strand, RNA genes, CDS with homology to known antimicrobial resistance genes, CDS with homology to know virulence factors, G+C content, and GC skew. The colors of the CDSs on the forward and reverse strands indicate the subsystems that these genes belong to.

