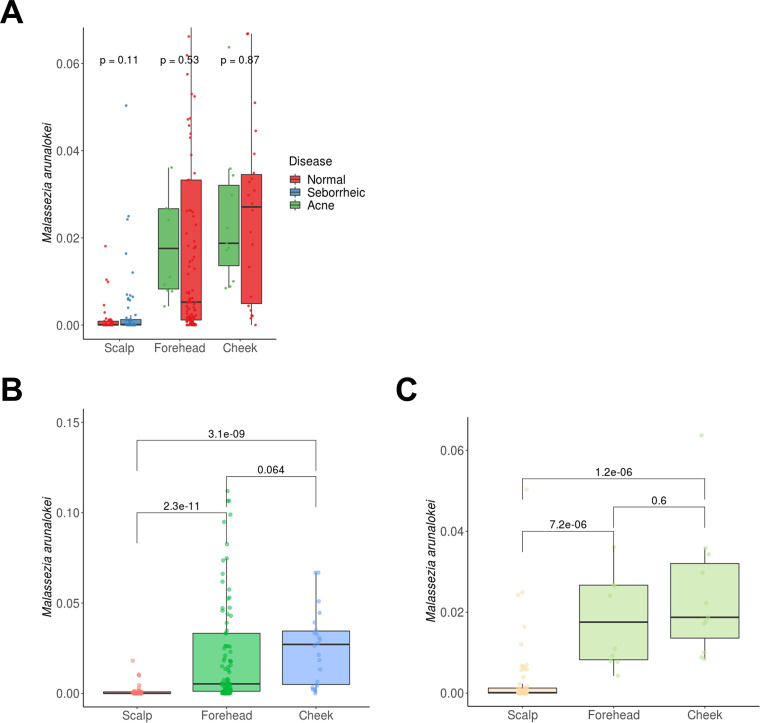
FIG 6.
Relative abundance of M. arunalokei at different facial skin sites in study cohorts. (A) Relative abundance of M. arunalokei between patient (seborrheic or acne) and healthy (normal) groups. (B and C) Relative abundance of M. arunalokei at different skin sites (scalp versus forehead and cheeks) in the (B) healthy and (C) patient groups. Values above the bar graphs are P values. The numbers of the samples used in the analysis are listed in Table 2.

