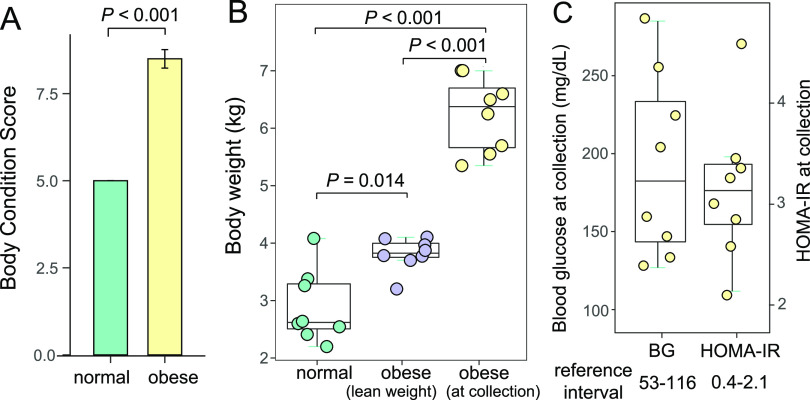
FIG 1.
Body weight, body condition score, serum glucose level, and insulin resistance parameters for obese cats. (A) Bar plot of the body condition scores of normal and obese cats in this study. (B) Box plot of the body weight of normal cats, obese cats when they were lean, and obese cats at the time of fecal and blood sample collection. (C) Box plot of the blood glucose scores (left) and homeostatic model assessment for insulin resistance (HOMA-IR) scores (right) of obese cats at collection.

