
FIG 2.
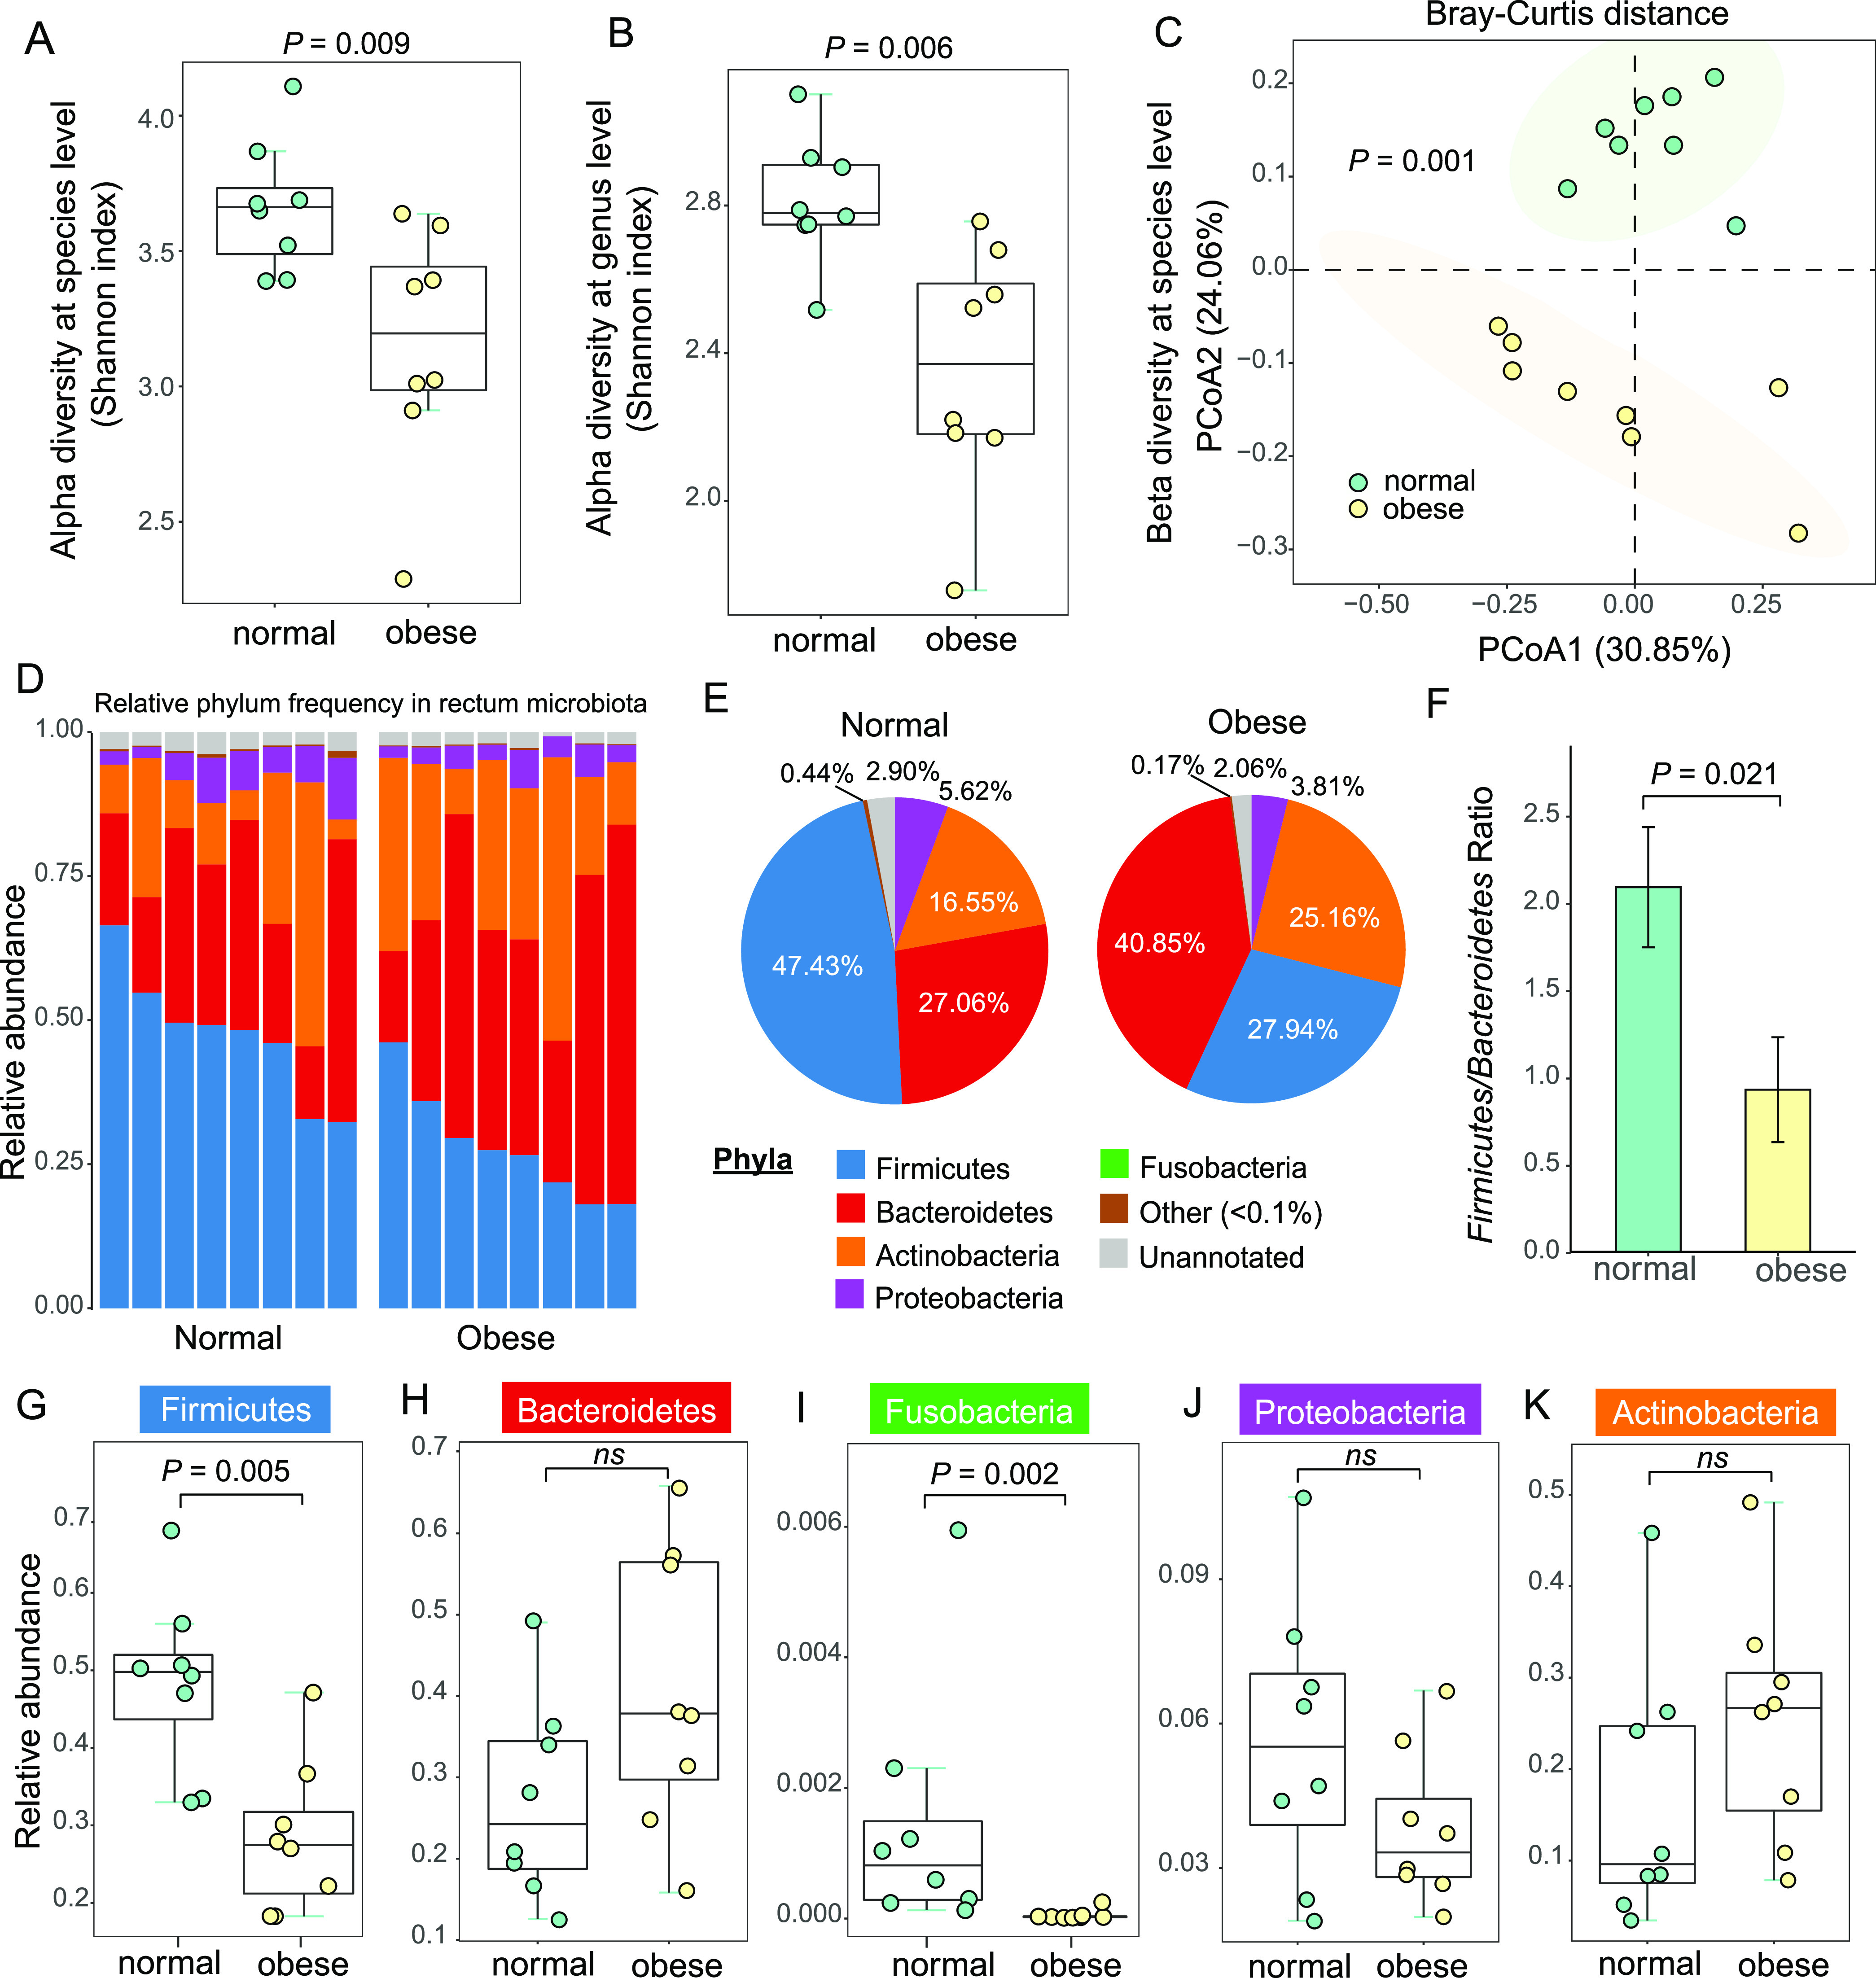
Significant changes of microbial diversity and phylum-level composition in cat gut microbiota. (A to B) Box plots of alpha diversity in normal (green) and obese (yellow) cat microbiota at the species (A) level and genus (B) level, measured using the Shannon index. (C) The PCoA plots of beta diversity between normal and obese rectum microbiota using Bray-Curtis distance. Statistical significance was assessed using permutational multivariate analysis of variance (PERMANOVA). (D) Bar plot of phylum-level relative frequency in normal and obese cat microbiota. (E) Pie charts of the phylum-level composition in normal and obese cat gut microbiota. (F) Bar plot of the Firmicutes-to-Bacteroidetes ratios in normal and obese cat gut microbiota. (G to K) Box plots of frequency for the five most abundant phyla: Firmicutes (G), Bacteroidetes (H), Fusobacteria (I), Proteobacteria (J), and Actinobacteria (K). Statistical significance was determined by the Mann-Whitney U test.