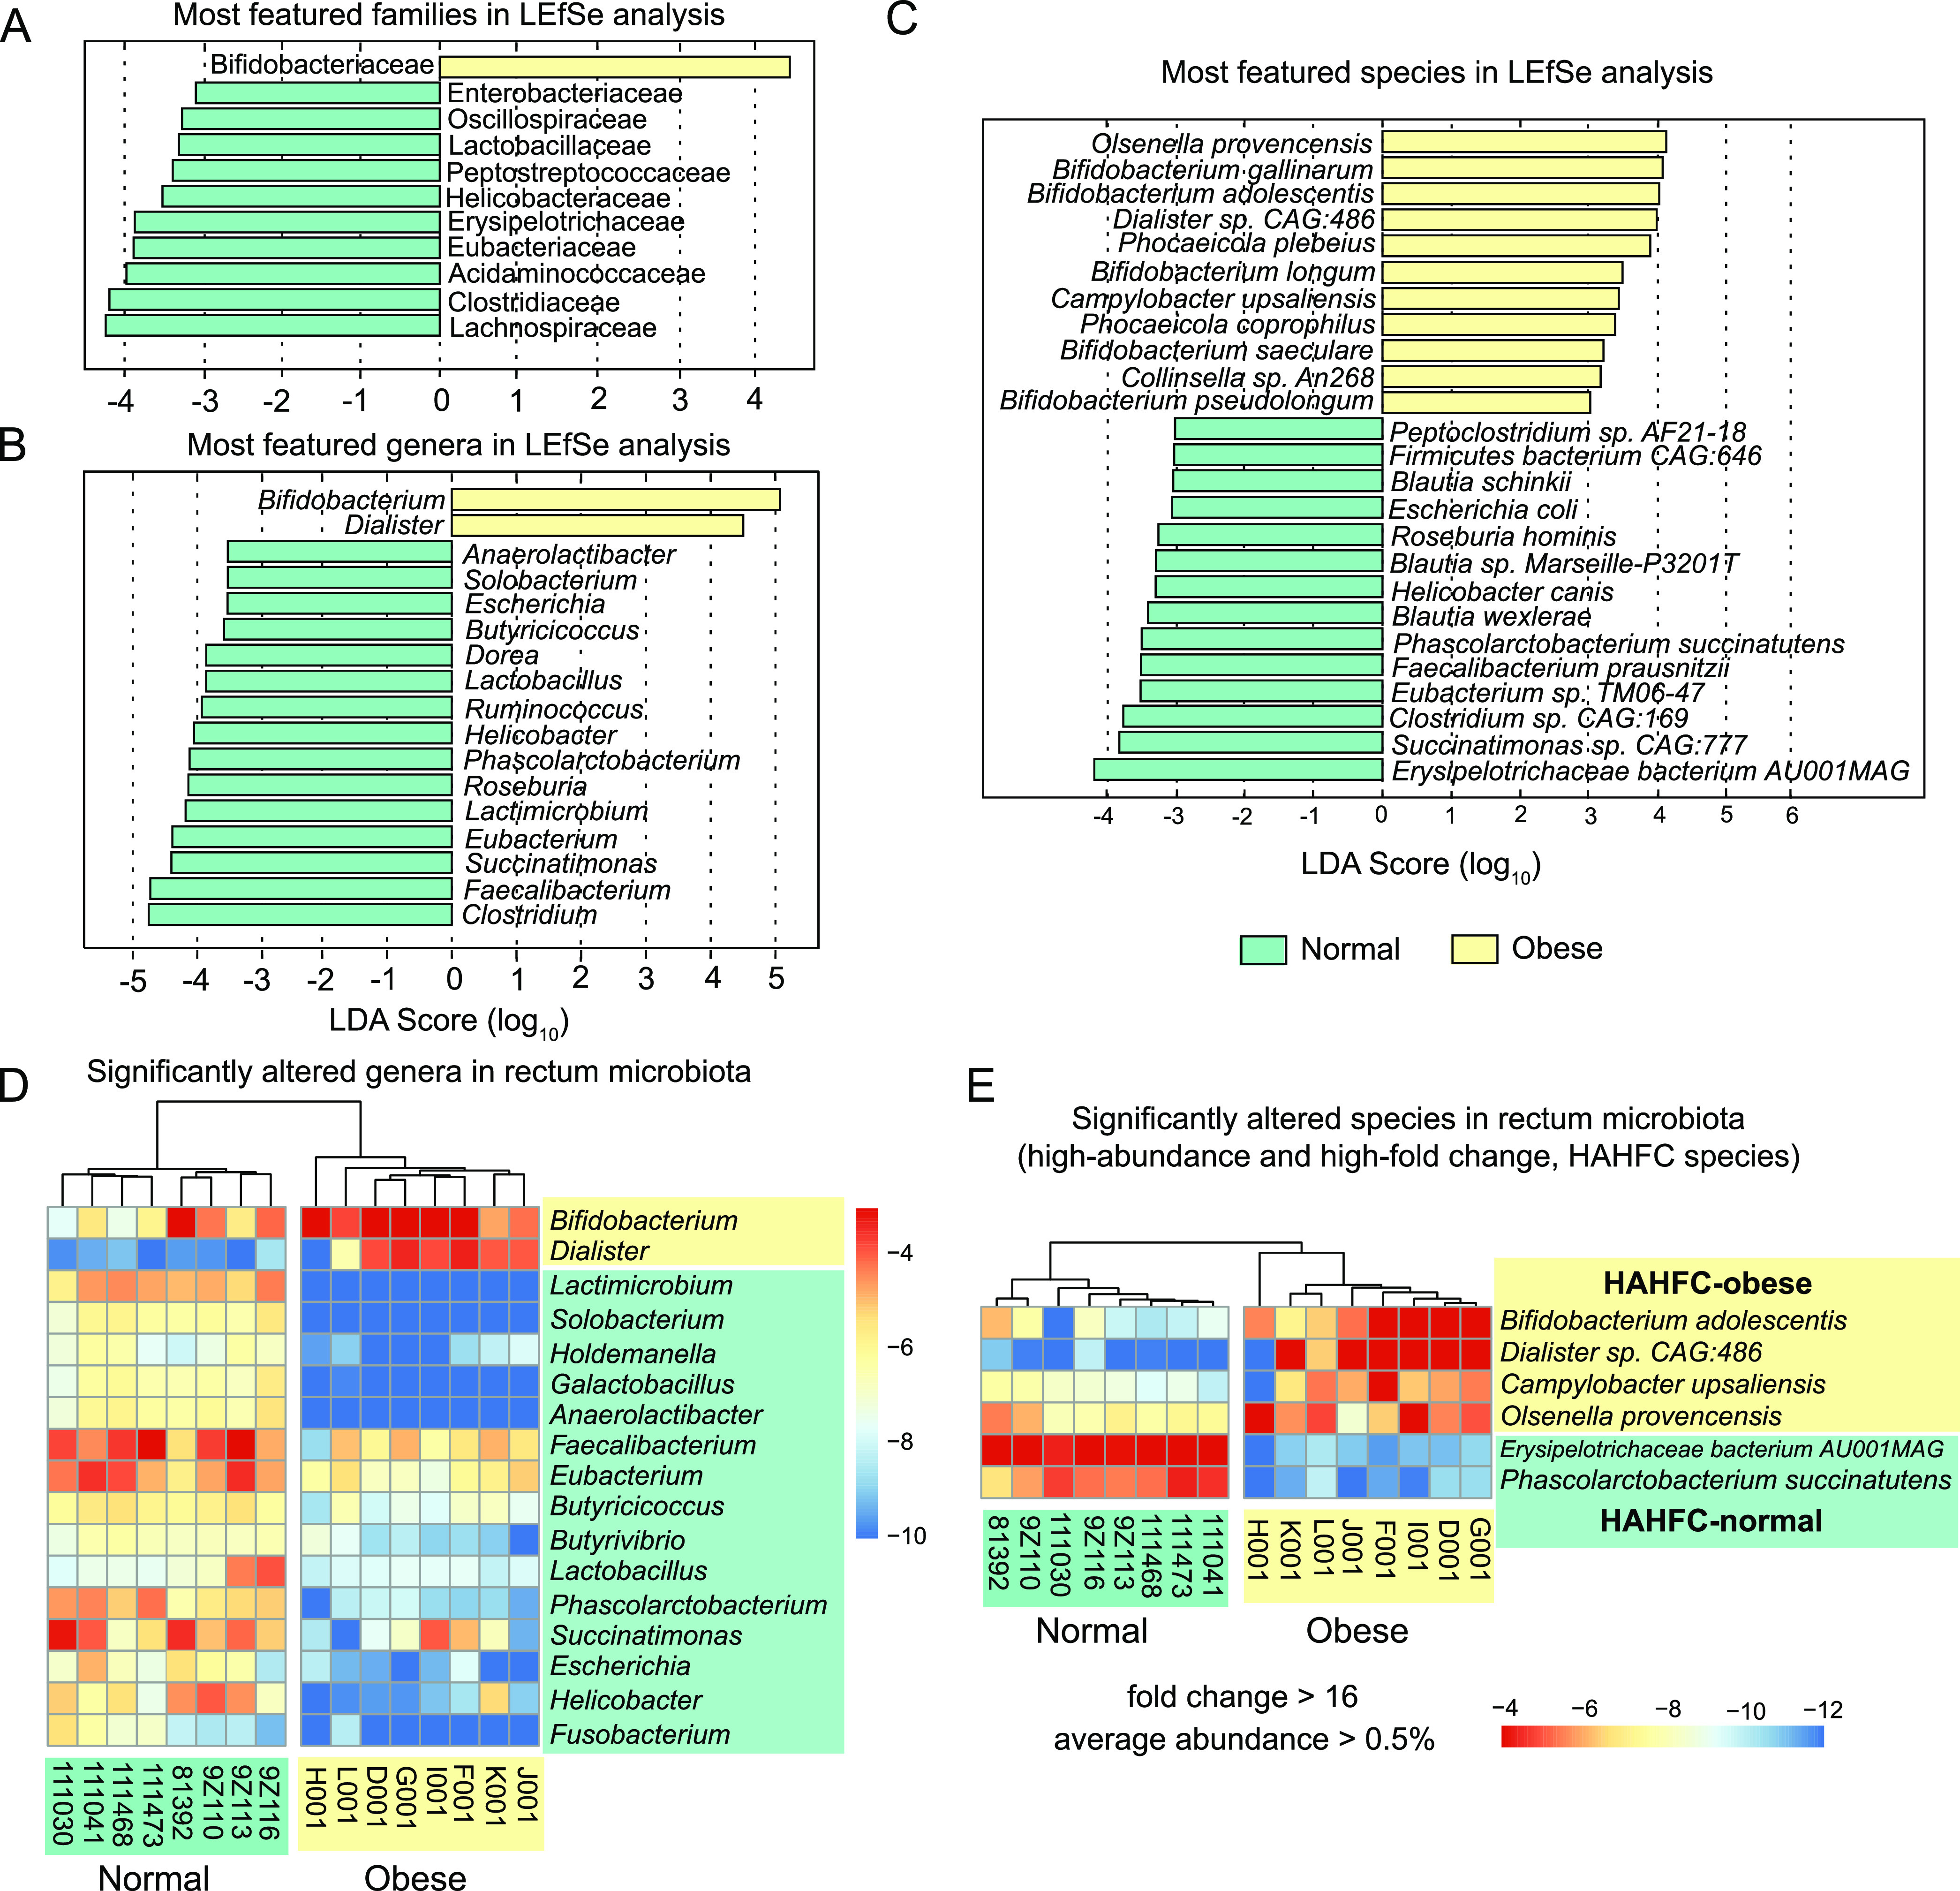
FIG 4.

Significant differences in taxonomic abundance that discriminate normal and obese cat gut microbiome at the family, genus, and species levels. (A to C) Linear discriminant analysis (LDA) scores of top featured microbial families (A), genera (B), and species (C) in normal (green) and obese (yellow) cat gut microbiota. Taxa with an LDA score greater than 3.0 were included in these plots. (D) Heatmaps of the relative frequency for significantly (FDR < 0.10) altered genera in normal (green) and obese (yellow) cat gut microbiota. Genera with an average frequency of at least 0.1% and a minimum absolute value of log2 fold change (log2FC) of 2 were included in the plot. (E) High abundant bacterial species (relative abundance > 0.5%) with high-fold change (>16) between normal (green) and obese (yellow) cat gut microbiota. Four species enriched in obese microbiota (HAHFC-obese) and two species enriched in normal gut microbiota (HAHFC-normal) were shown in the heatmap.
