
FIG 6.
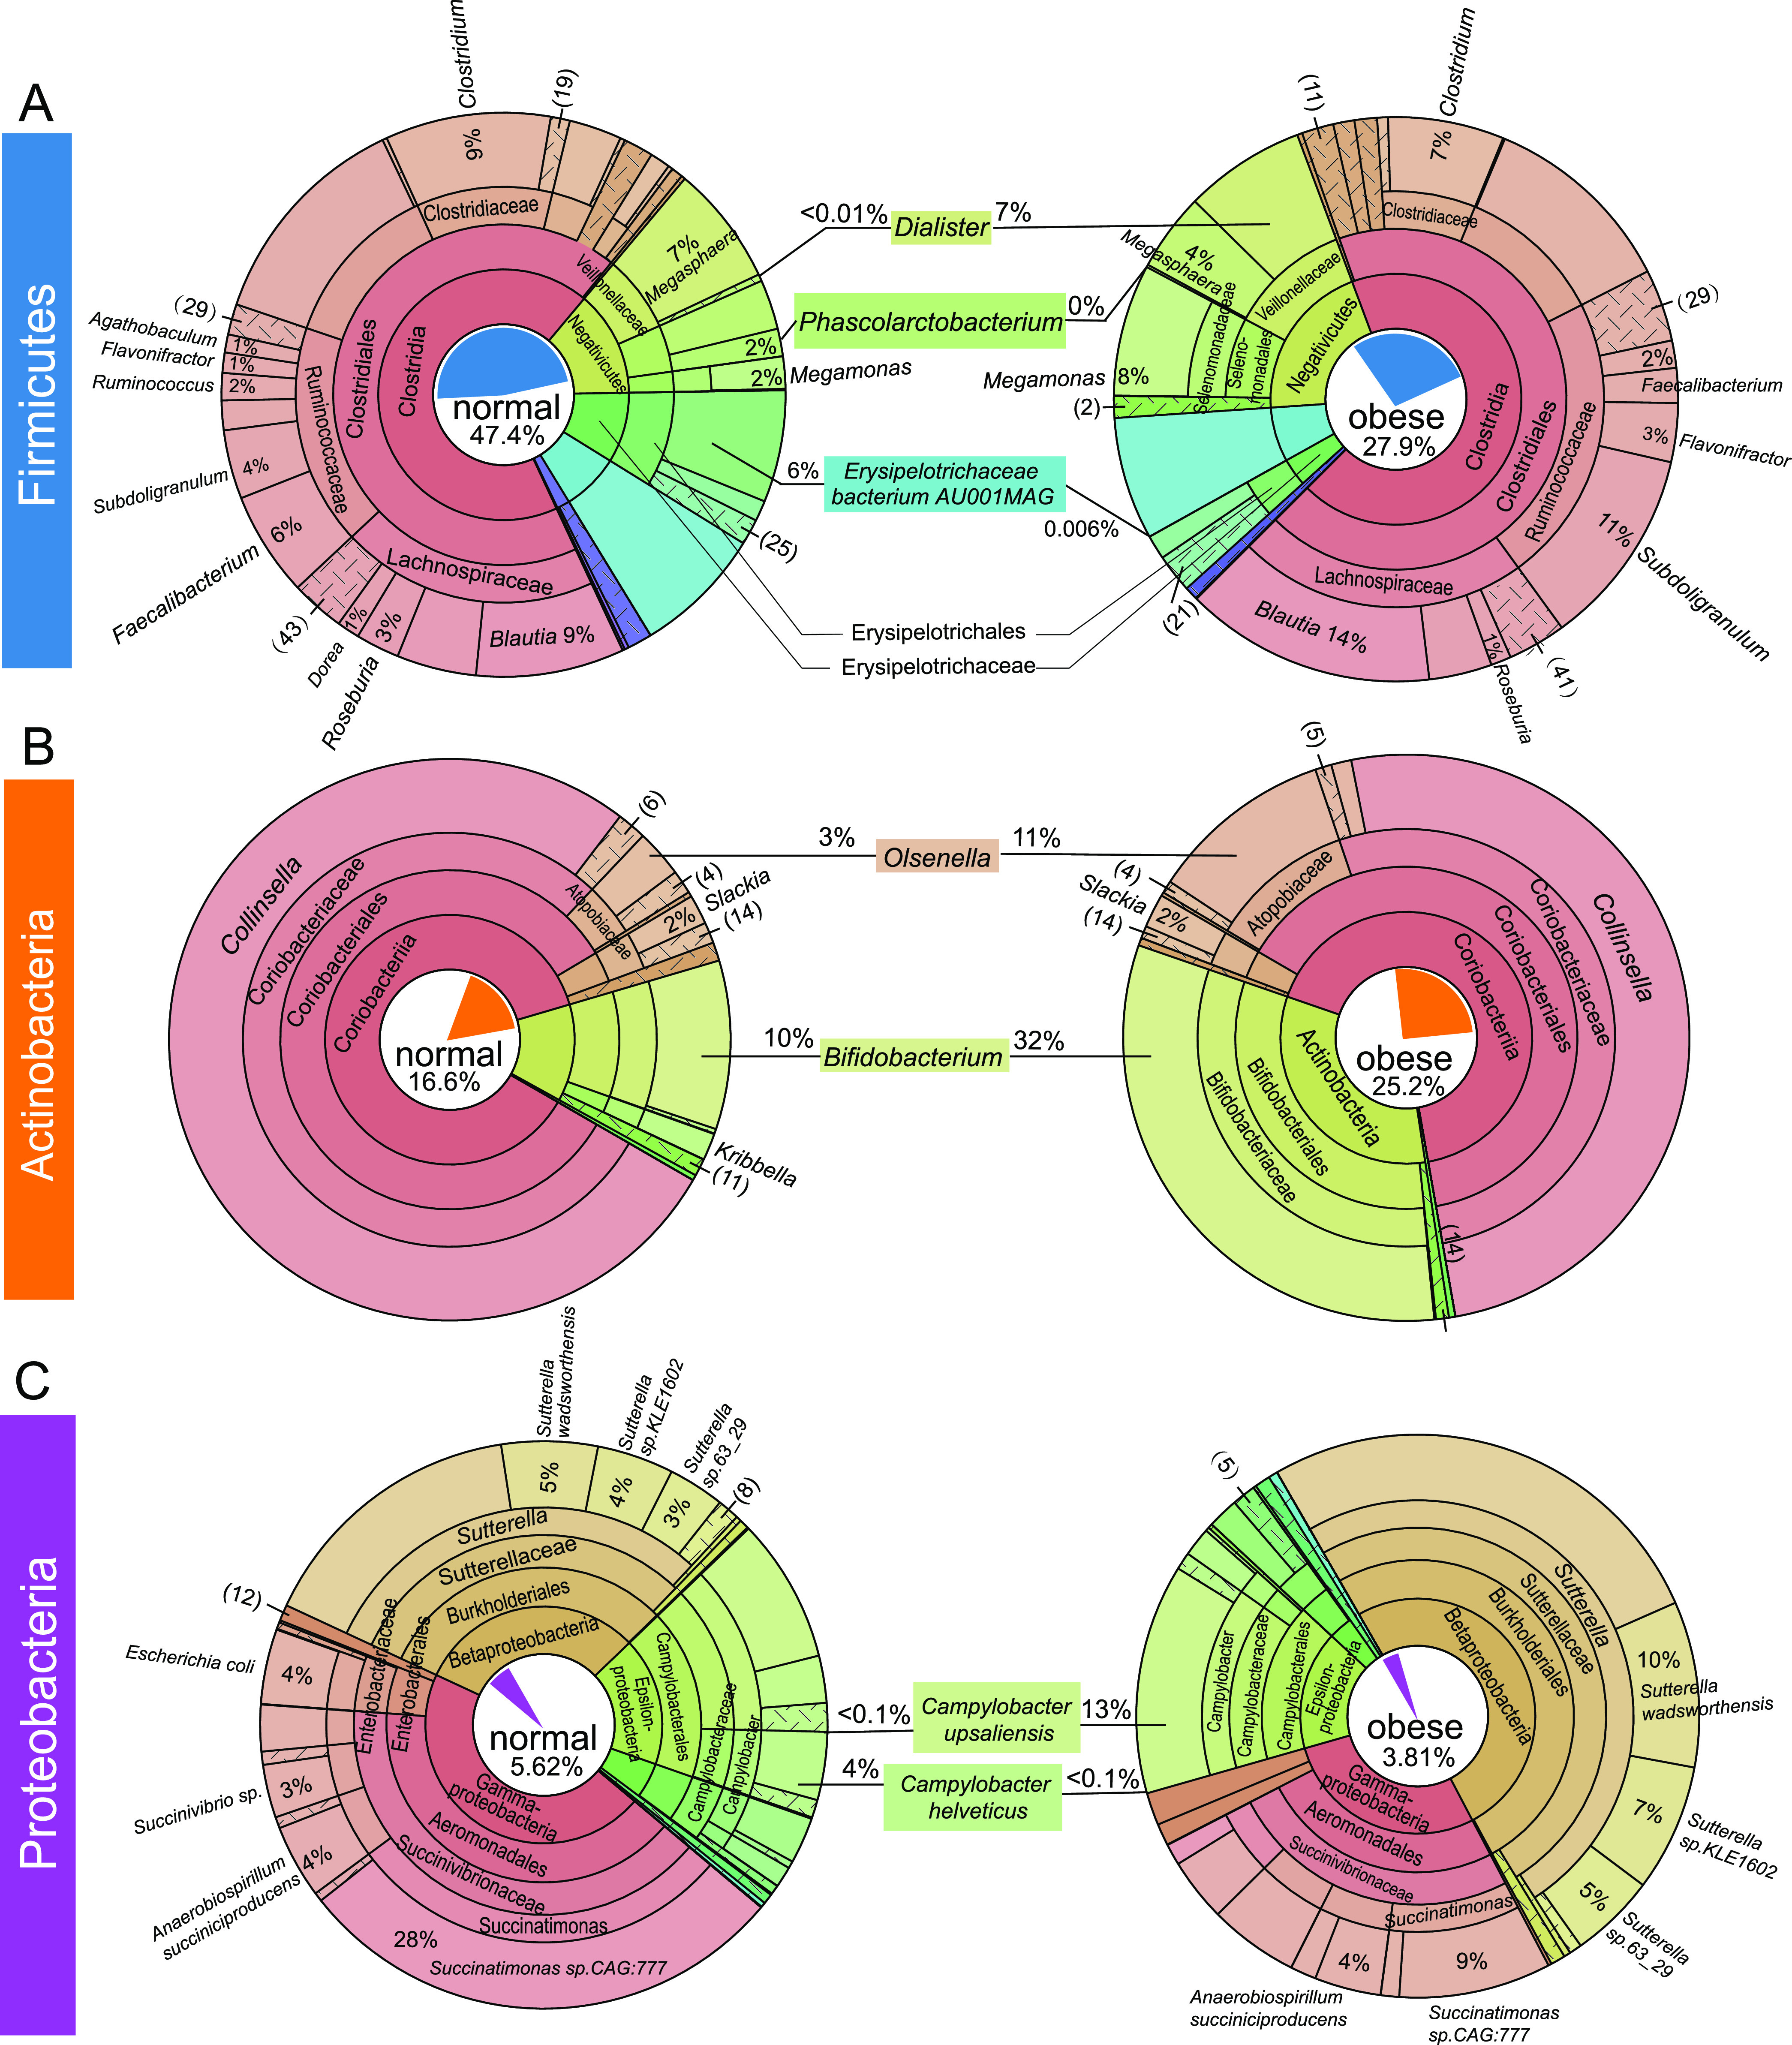
Krona plots reflecting the phylogenetic relationship and composition changes in Firmicutes, Actinobacteria, and Proteobacteria. Annotated taxonomy units within the phyla of Firmicutes (A), Actinobacteria (B), and Proteobacteria (C) were visualized in terms of relative abundance and taxonomic hierarchy for normal (left) and obese (right) cat gut microbiome. Different taxonomic terms are color-coded, and the composition percentages are labeled at the genus level (A, B) or the species level (C). The area in the chart is proportional to the relative abundance. The proportions of each phylum in the normal and obese microbiome were represented in a pie chart in the center of the circle.