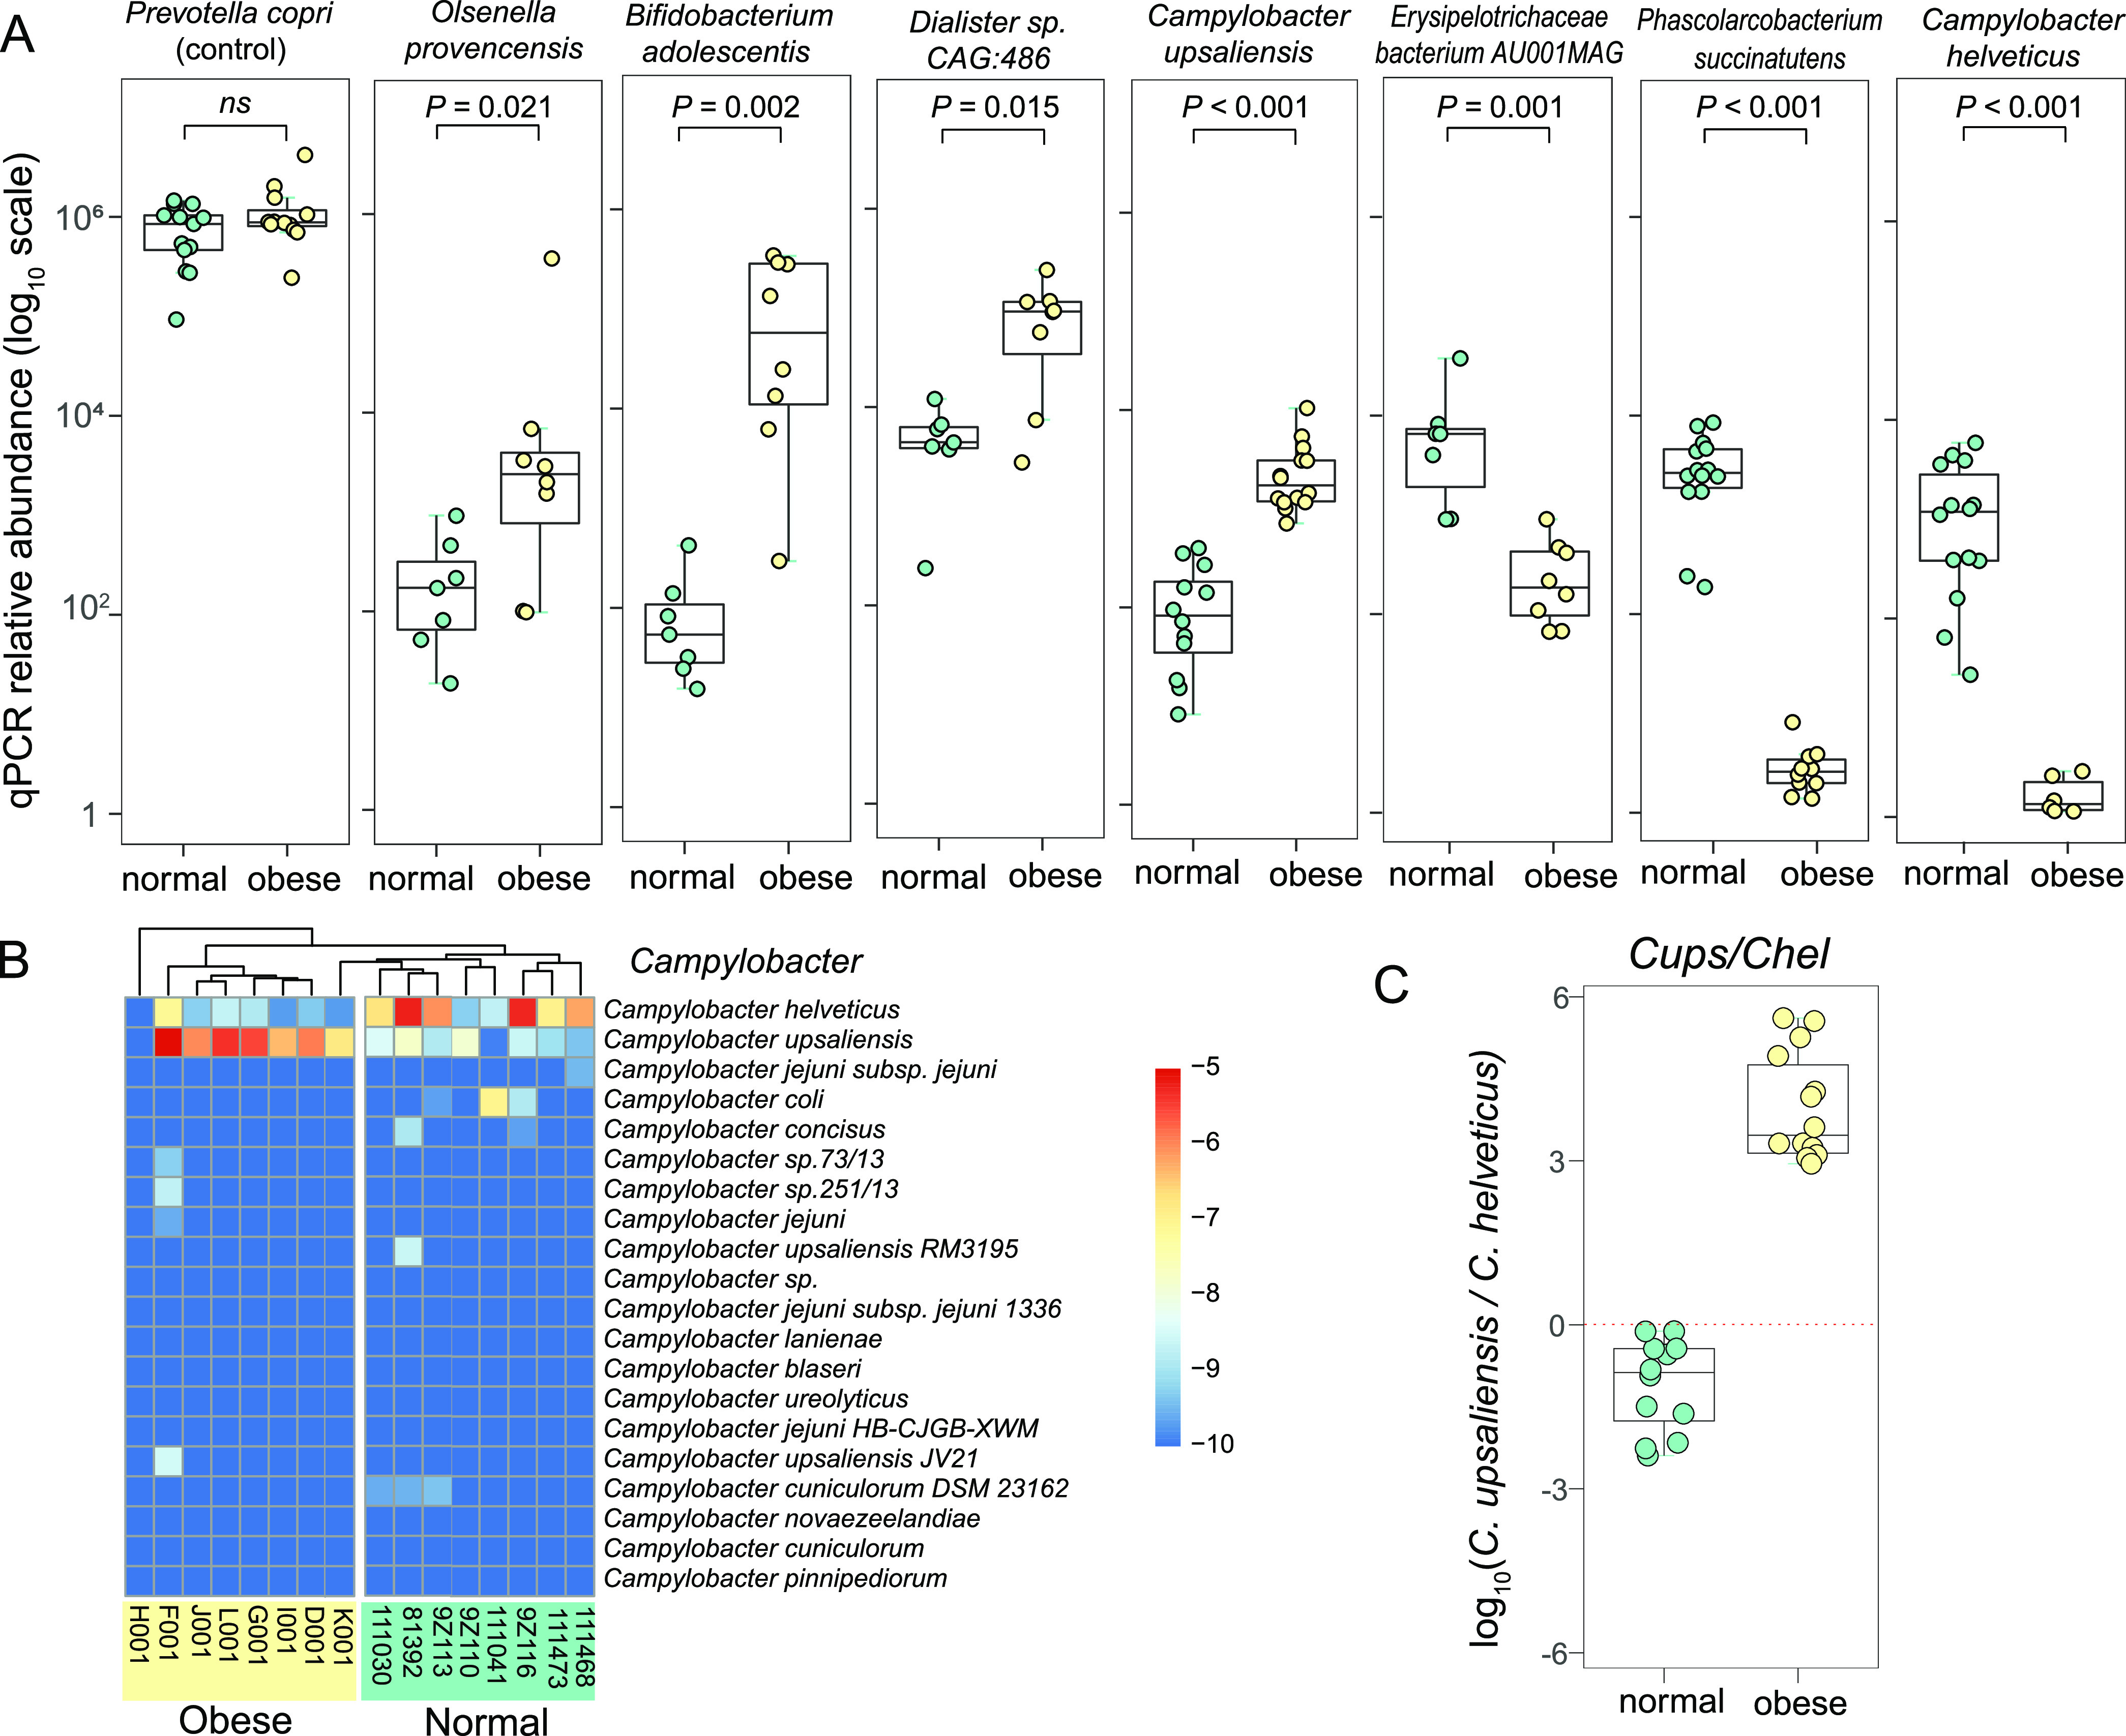
FIG 7.

Quantitative PCR validation of seven indicator bacterial species enriched or depleted in the obese cat gut microbiome. (A) Box plots of log10 scale qPCR relative abundance of Prevotella copri (control), Olsenella provencensis, Bifidobacterium adolescentis, Dialister sp.CAG:486, Campylobacter upsaliensis, Erysipelotrichaceae bacterium AU001MAG, Phascolarcobacterium succinatutens, and Campylobacter helveticus in normal (green) and obese (yellow) samples. (B) Heatmap of relative frequency for the top 20 most abundant Campylobacter species. (C) Box plot of log10 scale relative abundance ratio of Campylobacter upsaliensis over Campylobacter helveticus in normal (green) and obese (yellow) cat gut microbiome.
