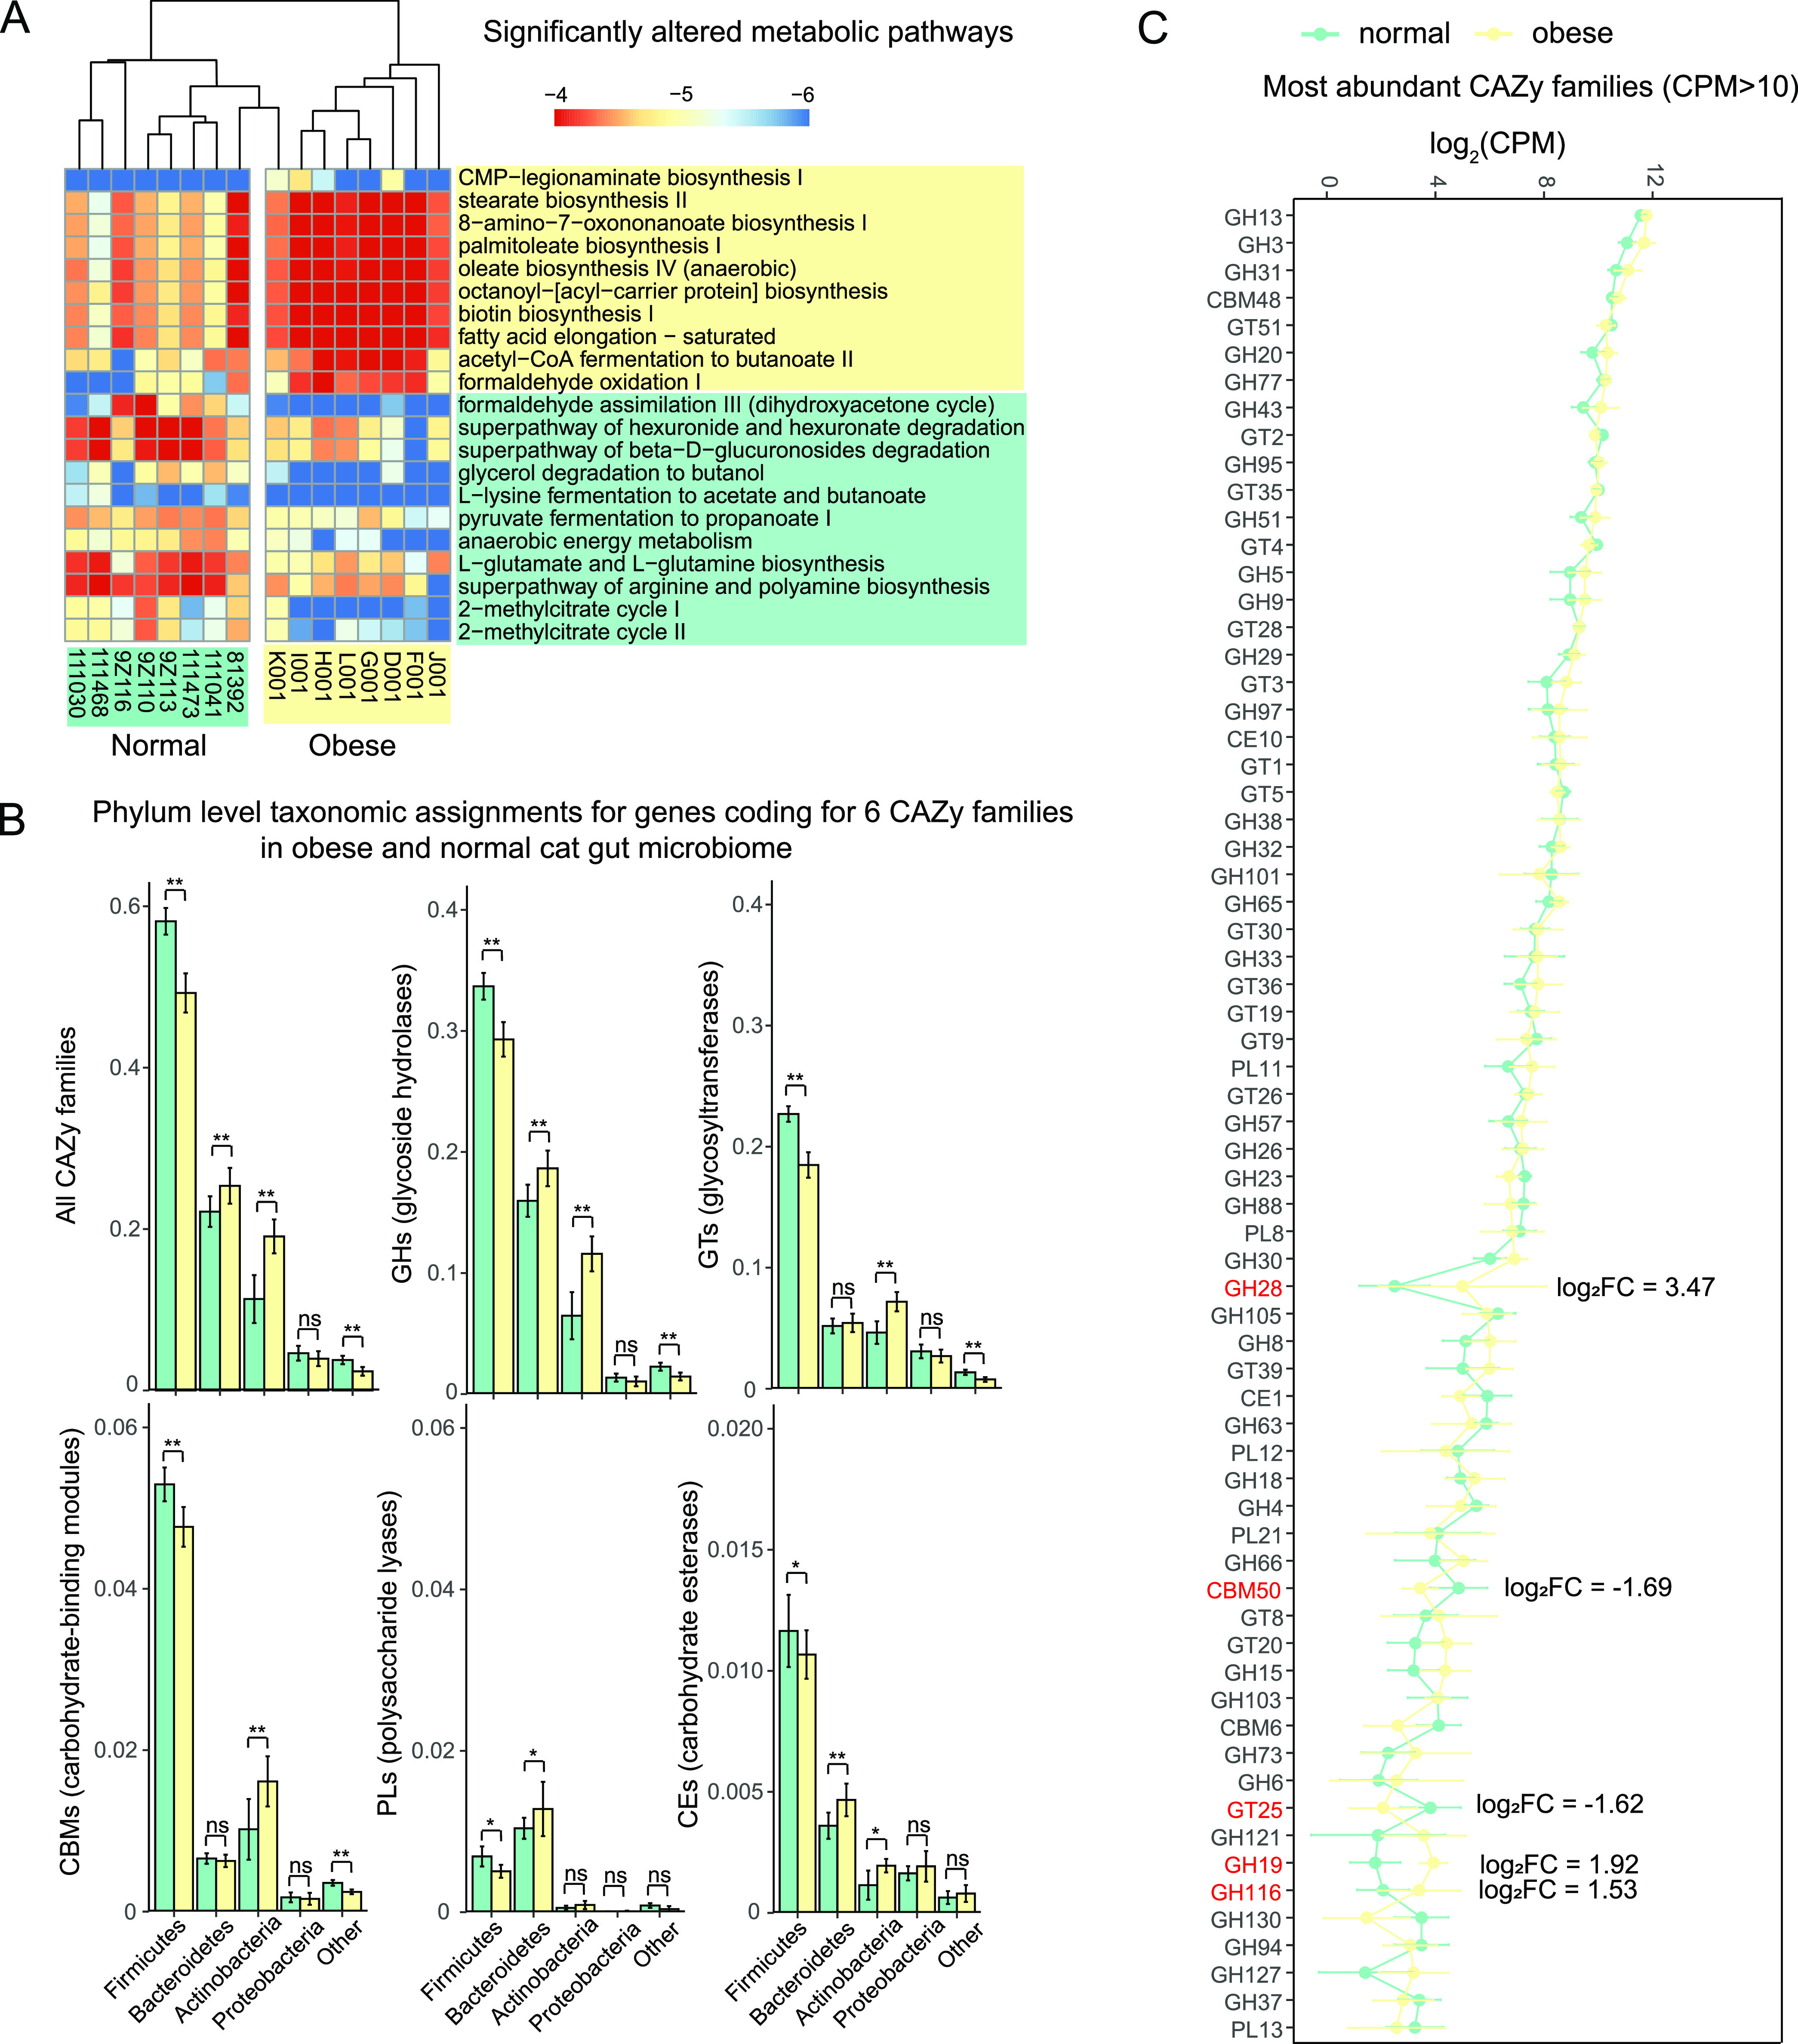
FIG 8.

Significantly altered metabolic pathways and CAZy families in obese and normal cat gut microbiota. (A) Heatmap of the relative frequencies for significantly (FDR < 0.10) altered microbial metabolic pathways in normal (green) and obese (yellow) cat gut microbiota. Pathways with a minimum absolute value of log2 fold change (log2FC) of 1.5 were included in the plot. (B) Bar plots of percentages for phyla to which CAZyme genes from different CAZy families in normal (green) and obese (yellow) cat gut microbiota belong. (C) Line plot of CPM (mapped reads) at log2 scale for most abundant CAZy families (CPM > 10) in normal (green) and obese (yellow) cat gut microbiota. CAZy families with a minimum absolute value of log2FC of 1.5 were denoted in red.
