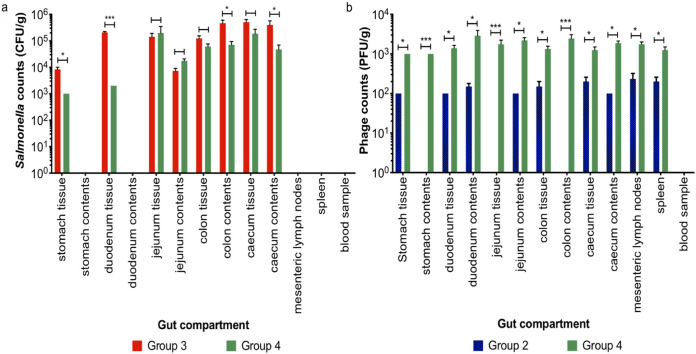
FIG 5.
Salmonella and phage counts in different gut compartments in the pigs. Graph (a) shows isolated Salmonella numbers from pig gut and blood samples from groups T3 (challenged with Salmonella—red bars) and T4 (challenged with Salmonella and fed the phage-feed diet—green bars). (b) Phage numbers recovered from pig guts and blood samples collected from groups T2 (fed the phage-feed diet—blue bars) and T4 (green bars). Data presented are averages in each treatment group and statistical differences between treatment groups are displayed on the graph (*, P < 0.05; ***, P < 0.001).

