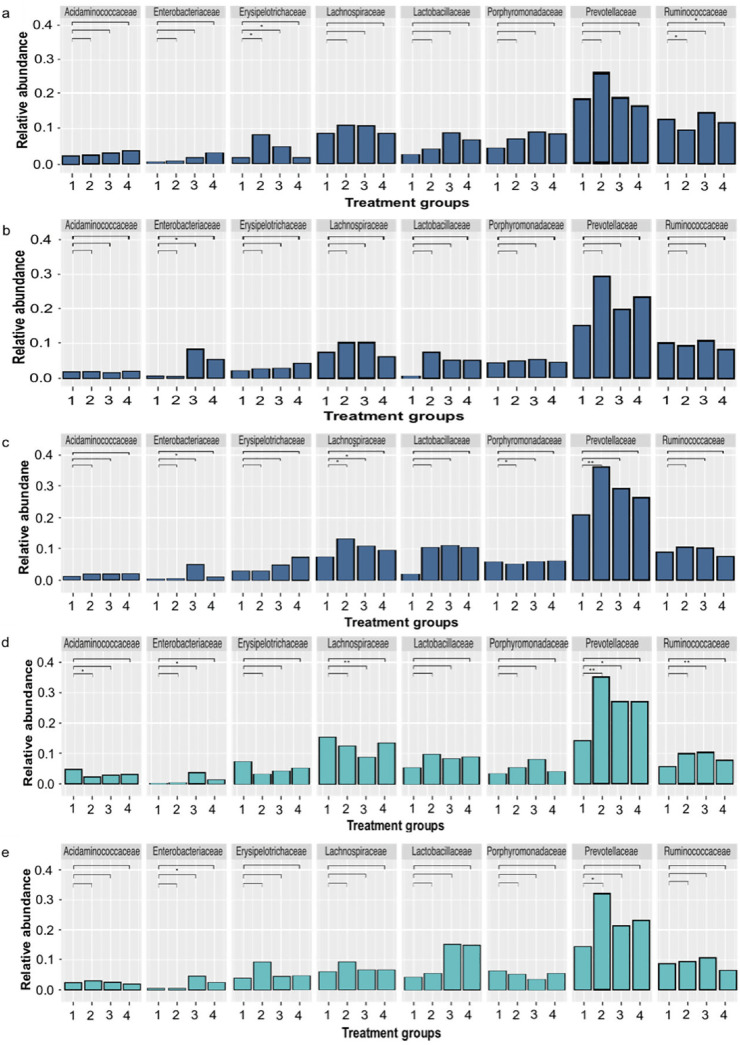
FIG 8.
Relative abundance of microbial communities in fecal, cecal, and colon samples from pigs at the family level. The pig fecal samples were collected 0 (a), 3 (b), and 5 (c) days postchallenge with Salmonella from treatment groups T1 (control), T2 (fed the phage-feed diet), T3 (challenged with Salmonella), and T4 (challenged with Salmonella and fed the phage-feed diet) and are shown in the dark blue bars. The cecum (d) and colon (e) samples were collected 5 days postchallenge from all treatment groups during the postmortem (turquoise-colored bars). Each bar represents the mean relative abundance of the treatment group, and relative abundance of the top 8 families are displayed. The relative abundance of each family in T1 (labeled as 1 on the graph) samples was compared to samples collected from groups T2 (2), T3 (3), and T4 (4). Statistical differences between treatment groups are displayed on the graph (*, P < 0.05; **, P < 0.01).

