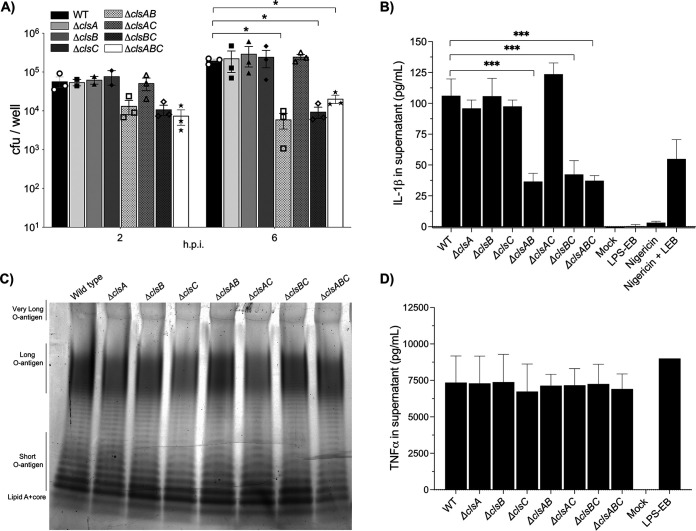
FIG 5.
clsB is necessary to promote S. Typhimurium infection for primary bone marrow-derived mouse macrophages (BMDMs) and IL-1β secretion when clsA or clsC is deleted. (A) Macrophages were infected with the WT and cls-mutant bacteria. The surviving intracellular bacteria were enumerated at 2 and 6 h postinfection (hpi). Triplicate wells were infected for each genotype. The graph depicts the individual mean number of CFU per well ± SEM for three independent experiments, except for ΔclsA, ΔclsB, and ΔclsC, which were tested only twice at 2 hpi. A two-way ANOVA followed by Dunnett’s posttest was used to determine statistical significance. Significant differences relative to the wild type are indicated by *, P < 0.05. (B) The supernatants of the infected cells depicted in panel A were collected at 6 hpi, and the levels of secreted IL-1β were freshly quantified using a sandwich ELISA. As a positive control for inflammasome induction and IL-1β secretion, macrophages were treated with the potassium ionophore, nigericin, and lipopolysaccharide from Escherichia coli O111:B4 (LPS-EB). Three wells were infected per bacterial genotype, and the data are shown as the average pg/mL ± SD of secreted IL-1β. The graph represents one of three independent experiments. To determine statistical significance, a one-way ANOVA was executed followed by Dunnett’s posttest. Significant differences are indicated (***, P < 0.001). (C) LPS molecules from stationary-phase cultures of WT and cls-mutant only were extracted, electrophoresed, and stained with ProQ300 Emerald. The gel represents one of three independent experiments. (D) The supernatants of the infected cells depicted in panel A were collected at 6 hpi, and the levels of secreted TNF-α were freshly quantified using a sandwich ELISA. LPS-EB was added at a concentration of 10 ng/mL to the macrophages as a positive control. Three wells were infected per bacterial genotype, and the data are shown as the average pg/mL ± SD of secreted TNF-α. The graph represents one of three independent experiments. To determine statistical significance, a one-way ANOVA was executed followed by Dunnett’s posttest. No significant difference was observed between the wild-type and mutant genotypes.

