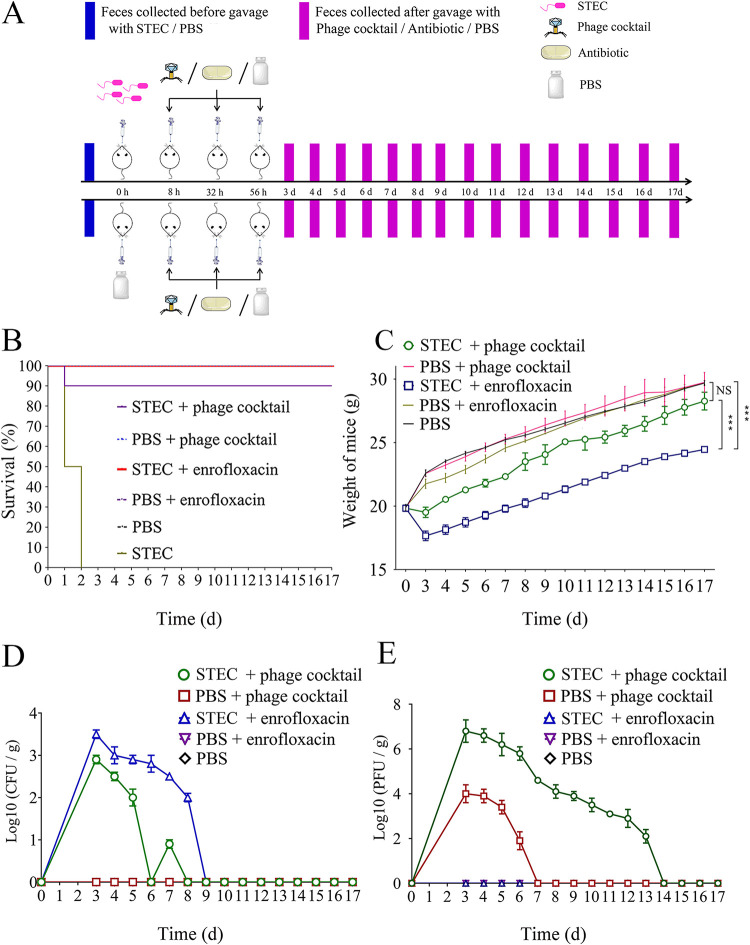
FIG 2.
Experimental design and health status of mice in each group. (A) Flow chart of gavage of mice in each group. (B) Overall survival. The number of mice in each group is 10. For each group of mice, the results shown are from two independent experiments. (C) Weight change of the mice in each group. (D) Monitoring of the number of STEC O157:H7 EDL933 bacteria in mice feces. (E) Monitoring of the number of phages in mice feces.

