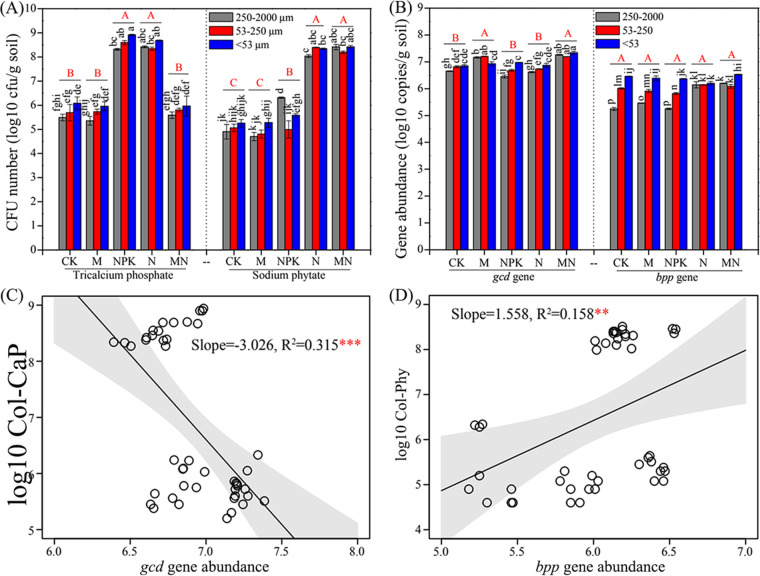
FIG 1.
Distribution patterns of phosphate-solubilizing bacteria and P-cycling-related genes and their relationships. (A and B) Numbers of phosphate-solubilizing bacteria (A) and abundances of P-cycling-related genes (B) in different soil aggregates under different fertilization treatments. The lowercase letters above the columns denote significant differences among soil aggregates under five fertilization treatments (P < 0.05), and capital letters represent significant differences among five fertilization treatments (P < 0.05). (C and D) Linear regressions reflect relationships between gcd gene abundance and tricalcium phosphate-solubilizing bacterial number (Col-CaP) (C) as well as between bpp gene abundance and phytate-degrading bacterial number (Col-Phy) (D). Asterisks denote significance (***, P < 0.001; **, P < 0.01).

