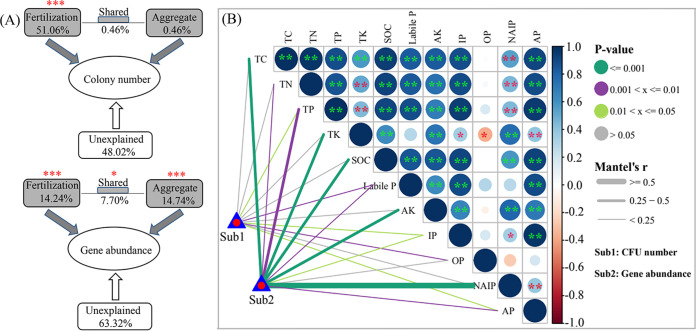
FIG 2.
(A and B) PERMANOVA showing effects of fertilization treatment and aggregate fractionation on PSB number and P-cycling-related gene abundance (A) and Mantel’s tests displaying influences of soil physicochemical factors on PSB number and P-cycling-related gene abundance (B). Color gradients and circles denote Spearman’s correlation coefficients. Edge width represents the Mantel’s r statistic for the corresponding correlation coefficient, and edge color represents the statistical significance based on 999 permutations. Asterisks denote significance (***, P < 0.001; **, P < 0.01; *, P < 0.05).

