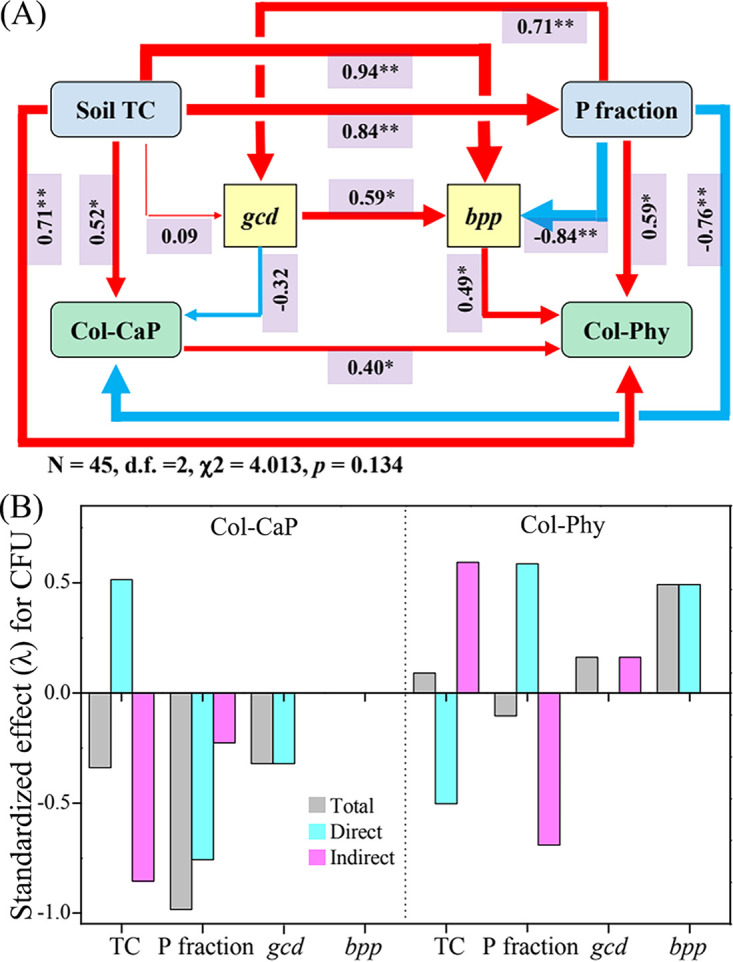
FIG 4.

(A) Structural equation model (SEM) showing the hypothesized causal relationships among components, including soil TC, P fractions, gcd abundance, bpp abundance, Col-CaP, and Col-Phy. The width of the arrows represents the strength of the standardized path coefficient, and values above the lines indicate path coefficients between two parameters. The red and blue lines indicate positive and negative path coefficients, respectively. Asterisks denote significance (**, P < 0.01; *, P < 0.05). (B) The direct and indirect effects of abiotic (i.e., soil TC and P fraction) and biotic (i.e., gcd and bpp) factors on PSB number (i.e., Col-CaP and Col-Phy).
