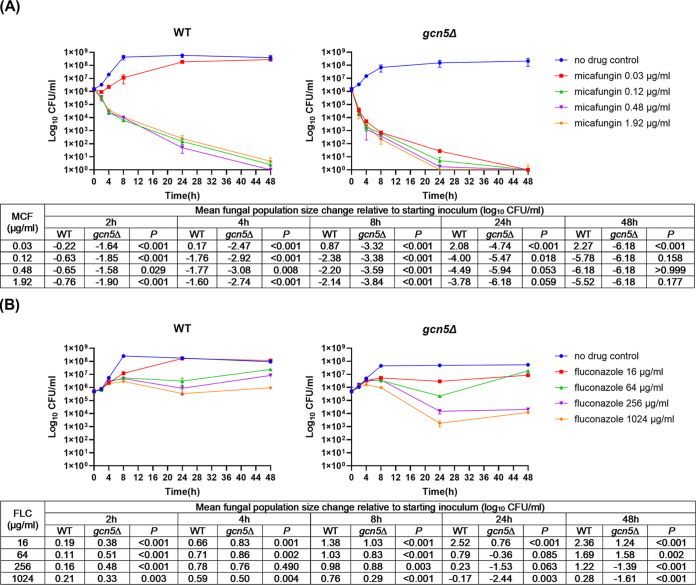
FIG 2.
Time-kill curve of micafungin and fluconazole against C. glabrata wild-type (WT) and gcn5Δ cells. The cells were incubated at 37°C in RPMI 1640 in the presence or absence of micafungin (MCF) and fluconazole (FLC) at the indicated concentrations. CFU counting was carried out at predetermined time points (0, 2, 4, 8, 24, and 48 h) after drug treatment. (A) Micafungin was significantly more potent against gcn5Δ than against WT cells. The 0.03-μg/mL micafungin treatment was fungicidal to gcn5Δ but not to WT cells. (B) Fluconazole was more potent against gcn5Δ than against WT cells, with significantly enhanced antifungal activity observed with treatment for 24 h or longer at concentrations of 256 and 1,024 μg/mL. Fungal population size change comparisons between WT and gcn5Δ cells at each time point are listed underneath the killing curves for micafungin and fluconazole, respectively.

