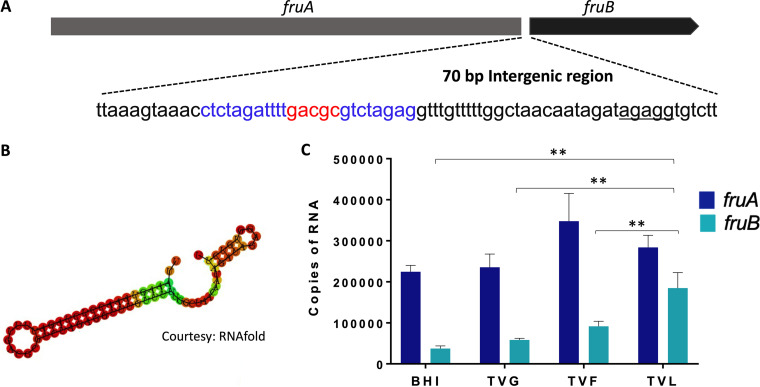
FIG 5.
Transcription analysis of the fruAB operon. (A) genes fruA and fruB are separated by a 70-bp intergenic region (igr) that included a partial inverse repeat highlighted in blue. (B) The secondary structure of the igr was predicted using the RNAfold web browser (34), with a free energy [ΔG = -21.24 Kcal/mol]. (C) mRNA levels of fruA and fruB of S. mutans UA159 grown under different carbohydrate sources were measured by RT-qPCR. Data are representative of at least three independent biological replicates performed in triplicates. Values are average and error bars indicate standard deviation across replicates. P < 0.005, by Student's t test.

