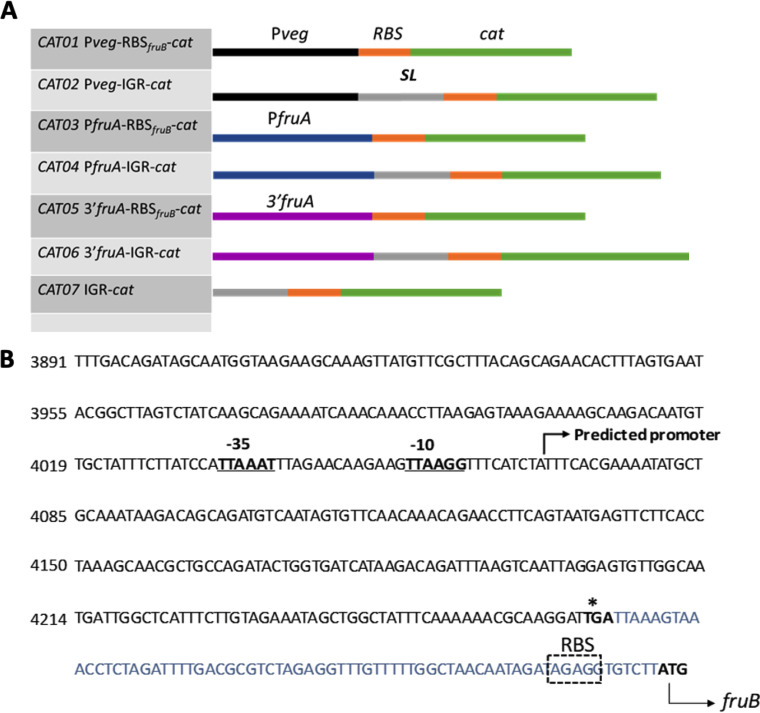
FIG 6.
Construction of reporter gene fusions. (A) Schematic diagrams of the cat-fusion constructs used in this study. The black bars represent promoters of Pveg (used as a control), the blue bars represent the fruA promoter region and the purple bars represent the 3′ end of the fruA coding sequence (B), presumably containing an internal promoter. The orange bars represent the putative ribosome binging site (RBS) of fruB gene, and the gray bars represent the rest of the 70-bp igr including a putative stem-loop structure (SL). The green bars represent the cat gene. (B) Relevant nucleotide sequence and likely features near the 3′ end of fruA. Online promoter prediction tool BPROM (SoftBerry) was used to assess the presence of a promoter. Underlined and in boldface are the extended -35 and -10 elements that may alternatively drive fruB transcription. The igr between fruA and fruB is highlighted in blue and the fruB RBS is represented in a box.

