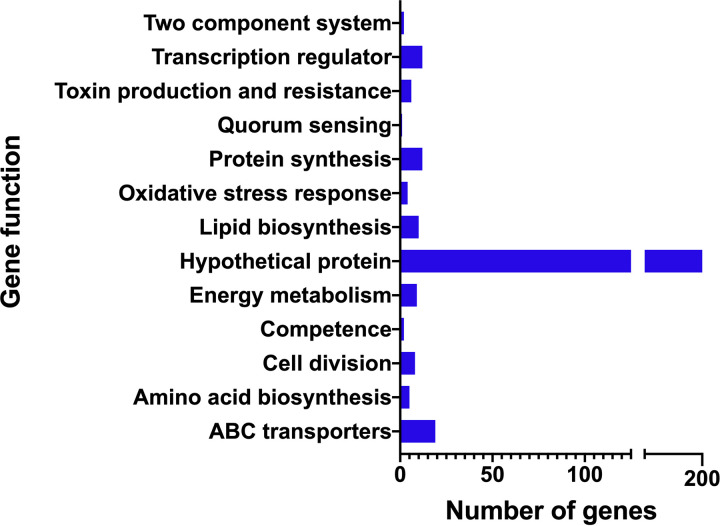
FIG 7.
Cumulative analysis of transcriptomic data. RNA-seq data were obtained from WT UA159 and strain △fruB, grown in the presence of 0.2% levan as sole carbohydrate source. The bar diagram shows the numbers of genes with significant changes related to various cellular functions, collectively indicating a global change in the gene expression profile in ΔfruB as it adapts to the presence of levan.

