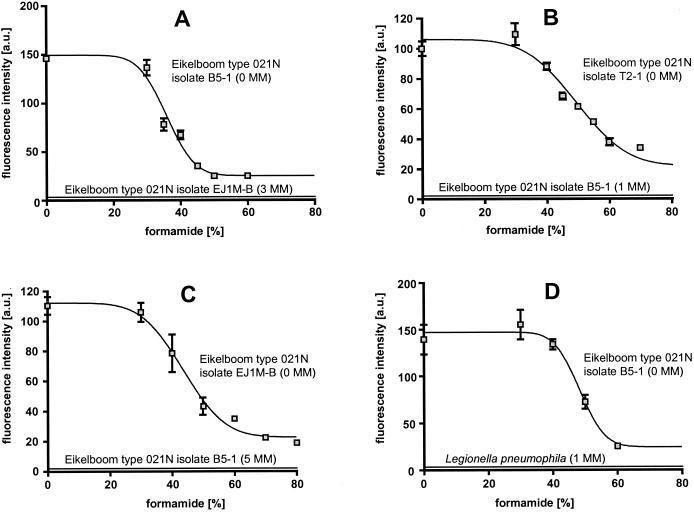
FIG. 3.
Probe dissociation curves of newly designed probes under increasingly stringent hybridization and washing conditions. For each data point mean fluorescence intensity values (arbitrary units [a.u.]) of at least 100 cells of the filaments and suitable nontarget reference organisms were determined. Error bars indicate the standard deviation. (A) probe G1B, specific for group I; (B) probe G2M, specific for group II; (C) probe G3M, specific for group III; (D) probe G123T, specific for the Eikelboom Type 021N-Thiothrix cluster. For each microorganism used, the number of mismatches (MM) with the respective probe is given in parentheses. It should be mentioned that the nontarget organisms with one mismatch (strain B5-1 and L. pneumophila) were slightly visible to the human eye after nonstringent hybridization with the respective probes. However, due to constraints of the eight-bit digital image analysis software, these weak signals could not be recorded with the confocal microscope during the probe dissociation curve experiments.

