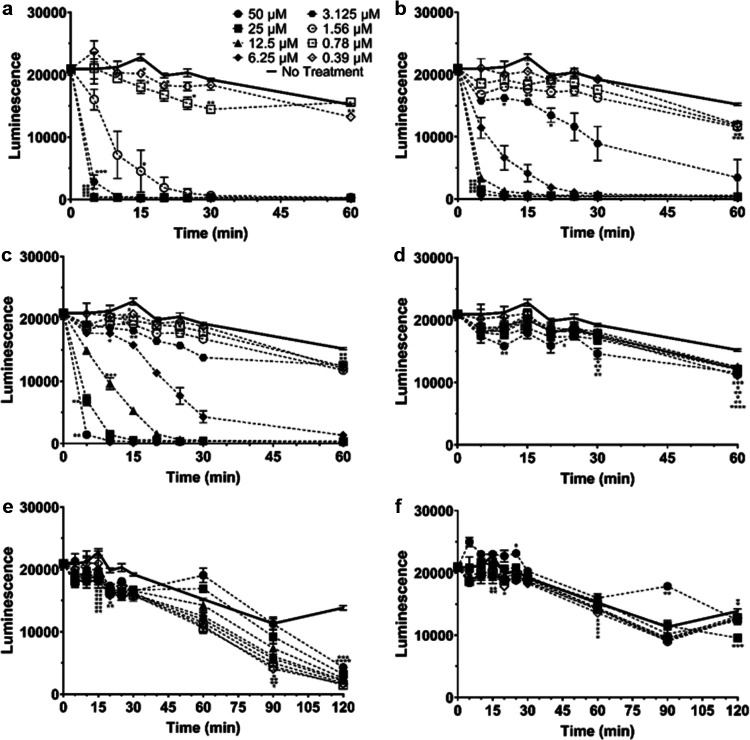
FIG 7.
Kinetics of killing over 60 to 120 min in LB for Xen29 with (a) Peptoid 1, (b) Peptoid 1-C134mer, (c) Peptoid 1-11mer, (d) LL-37, (e) vancomycin, and (f) daptomycin. Luminescence was measured over 60 min, at 5-min intervals up to 30 min. Concentrations ranging from 0.39 to 50 μM were tested for each peptoid, peptide, and antibiotic. (a) For Peptoid 1, concentrations of 3.125 μM and higher showed a significant decrease compared to the no treatment control for all time points. For 1.56 μM Peptoid 1, showed significance starting at 15 min. Peptoid 1 showed a significant decrease for 0.78 μM at 15 min and once again from 25 to 30 min while it showed a significant decrease for 0.39 μM from 15 to 20 min and once again at 60 min. (b) for Peptoid 1-C134mer, concentrations of 6.125 μM and up were significantly different than the no treatment control for all time points. At 3.125 μM, Peptoid 1-C134mer showed a significant decrease from 10 to 25 min, while 1.56 μM showed significance at 15 min and from 25 min onward. Both 0.78 μM and 0.39 μM show significance at 15 min and once again at 60 min. (c) For Peptoid 1-11mer, significance was seen for 25 μM and 50 μM for all time points tested. At 6.25 μM and 12.5 μM, significance began after 10 min, while for 3.125 μM and 1.56 μM, significance was seen after 15 min. 0.78 μM and 0.39 μM showed a significant decrease at 15 min as well, however, they both didn’t show significance again until 60 min. (d) LL-37 showed a significant decrease for 50 μM and 25 μM starting at 10 min onward, however, 50 μM was not significant at 20 min while 25 μM was not significant at 30 min. 12.5 μM LL-37 showed significance at 15 min and from 30 min onward, while 6.25 μM only showed significance at 15 min and 60 min. 3.125 μM was significant only at 60 min, while 1.56 μM and 0.39 μM were significant from 30 min onwards. 0.78 μM was significant at 15, 25 and 60 min. (e) Vancomycin showed significance for 50 μM and 25 μM from 15 min to 30 min, and again at 120 min. At 12.5 μM, vancomycin showed significance from 15 to 30 min, and from 90 min onwards. At 6.25 μM and 0.78 μM, vancomycin showed significance from 15 min onward. 1.56 μM showed significance from 15 min to 30 min and from 90 min onward while both 3.125 μM and 0.39 μM were significant from 20 min to 30 min and from 90 min onward. (f) Daptomycin showed significant increases for 50 μM at 25 min and 90 min, however, showed a decreases compared to the no treatment control at 120 min. Both 25 μM and 12.5 μM daptomycin showed a significant decrease at 120 min, while 6.25 μM daptomycin showed an initial decrease at 15 min, and again at 60 min. 3.125 μM and 0.78 μM showed a significant decrease at 60 min, while 1.56 μM showed a significant decrease at 15 min and again at 60 min. 0.39 μM showed a significant decrease at 30 min and 60 min. All data points are represented as means using three replicates. Error bars are represented as ± standard deviation (SD). Statistics were performed using 2-way ANOVA, comparing each concentration over time to the no treatment control. P values are: <0.0001 = ****, between 0.0001 and 0.001 = ***, between 0.001 and 0.01 = **, and between 0.01 and 0.05 = *.

