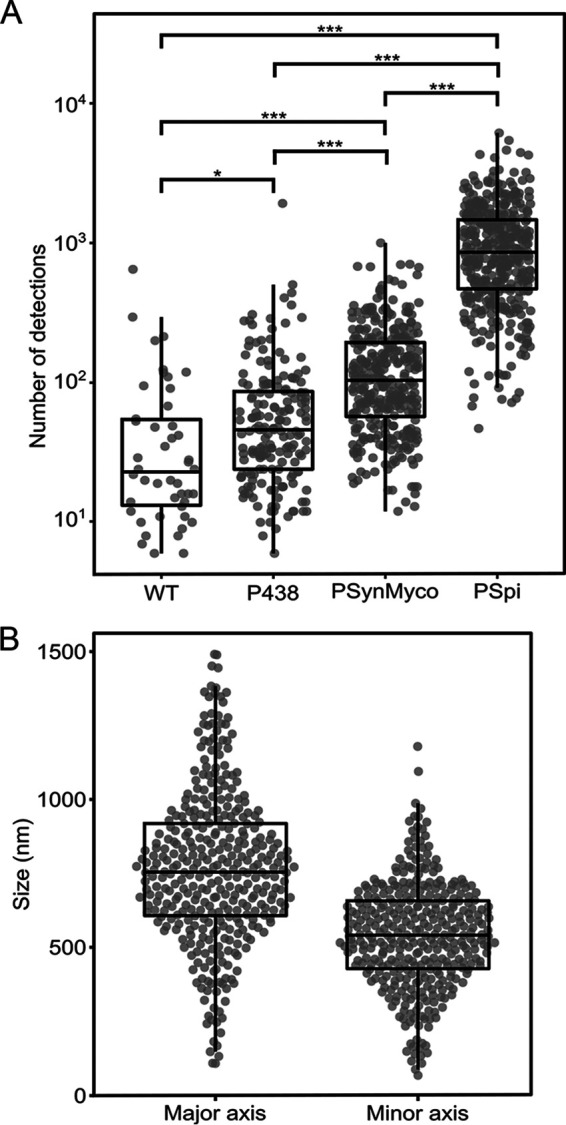
FIG 5.

Evaluation of promoter strength and cell size through PALM imaging in M. mycoides subsp. capri. (A) Comparison of promoter strength by PALM imaging. M. mycoides subsp. capri cells, either wild type (WT) or transformed with plasmid pMT85-P438-mEos3.2 (promoter P438), pMT85-PSynMyco-mEos3.2 (promoter PSynMyco), or pMT85-PSpi-mEos3.2 (promoter PSpi), were imaged by PALM. For each strain, the data collected from a single representative field of view (512 by 512 pixels; pixel size = 0.16 μm) were analyzed. The dot plot presents the number of detections measured in each object segmented by Tesseler (equivalent to a cell), on top of which a boxplot showing the median, interquartile range, minimum, and maximum values is overlaid. Statistics tests (Mann-Whitney) were performed to compare the four strains (*, P < 0.05; ***, P < 1.10−10). (B) Deriving cell size data from PALM images. M. mycoides subsp. capri cells transformed with plasmid pMT85-PSpi-mEos3.2 were imaged by PALM. The data collected from a single representative field of view (512 by 512 pixels; pixel size = 0.16 μm) were analyzed. The dot plot presents the dimensions (in nm) of the major axis and the minor axis of each object segmented by Tesseler (Fig. S7), on top of which a boxplot showing the median, interquartile range, minimum, and maximum values is overlaid.
