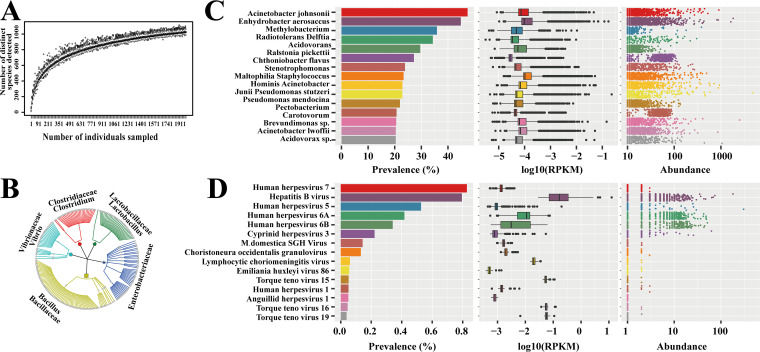
FIG 1.
Outline of peripheral blood microbiome analysis in this nationwide study. (A) Species counts with different sample sizes to check for potential saturation effect. (B) Top 5 families of detectable microorganisms from HMREFG. (C) Prevalence, log10(RPKM), and absolute abundance values of the top 15 most frequently detected bacteria. (D) Prevalence, log10(RPKM), and absolute abundance values of the top 15 most frequently detected viruses.

