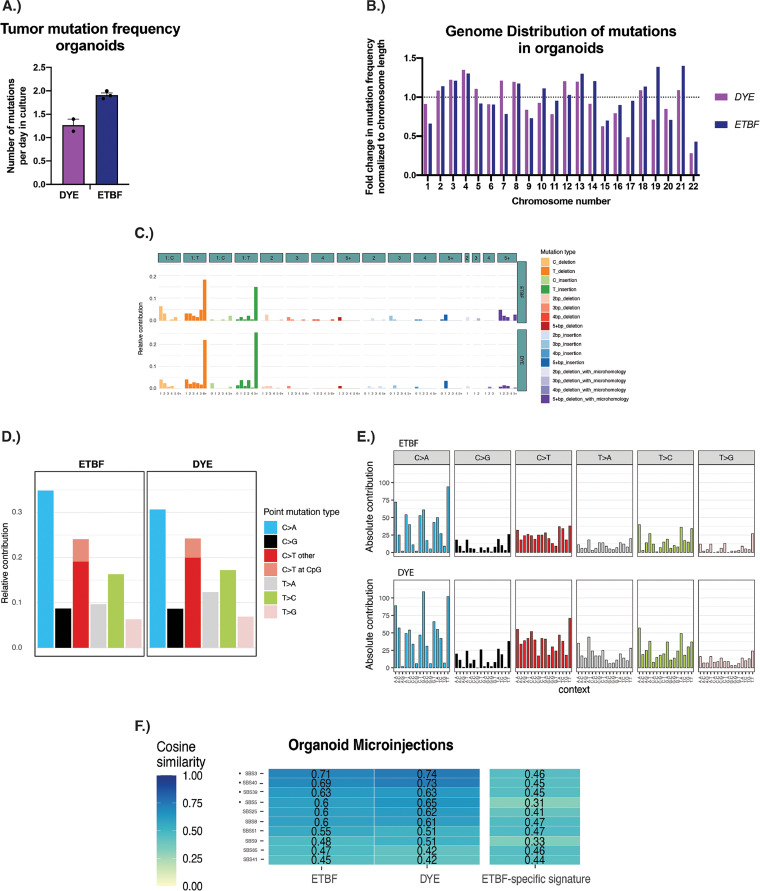
FIG 4.
ETBF-induced mutational analyses in an organoid model of ETBF-colonization. (A) Plot showing the number of combined SNVs and indels identified via whole-genome sequencing analysis. The mutation rate per day in culture is identified. Error bars represent standard error of the mean. To determine the mutational load estimate during culture, mutation numbers were divided by the number of days the samples have been in culture. (B) Distribution of mutations throughout the genome. Only autosomal chromosomes are shown. Results were normalized to the length of each chromosome. The dotted line at 1 indicates the expected value if the mutational burden for each chromosome was evenly distributed. (C) Indel mutational profiles in the 83-mutation type format. This format groups indels based on several criteria including size of the indel, nucleotides affected, and the presence of the indel in a repetitive region and/or microhomology region. (D) SNV mutational profile in the 6-mutation type format. In the 6-mutation type format, mutations are divided into 6 categories as follows: C > A, C > G, C > T, T > A, T > C, and T > G. Additionally, C > T mutations are further subdivided into those that occur within a CpG dinucleotide context and those that do not. (E) SNV mutational profile in the 96-mutation type format. In the 96-mutation type format, the 6 mutations outlined above are further subdivided into 16 categories, which represent the 16 combinations of nucleotides immediately 5′ and 3′ to each mutated base. (F) Heatmaps comparing SBS COSMIC signatures (vertical axis) to the mutational profiles created from whole-genome sequencing data in organoids. Numbers displayed represent “cosine similarity,” which is a metric used to quantify the similarity between any two mutational matrices. Only the top 10 COSMIC SBS signatures are shown. Dots indicate mutational profiles most similar to ETBF signature.

