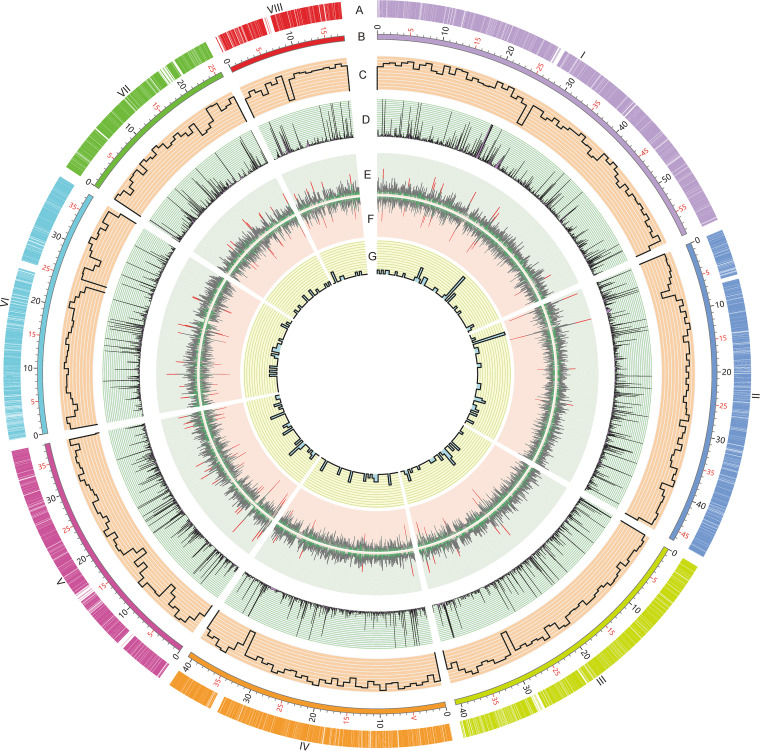
FIG 1.
Circular map indicating the genomic features of P. oxalicum genome. (A) Locations of predicted genes. The Roman numbers represent the chromosomes. (B) Schematic representation of chromosomal size (Mb scale). (C) Gene density represented by number of genes in 100-kb nonoverlapping windows. (D) Gene expression under Avicel induction. (E) Exon numbers in protein-coding genes. Red lines represent exon number (>10) in a gene, whereas green color indicates one exon contained. (F) Intron numbers in protein-coding genes. Red lines represent intron number (>10) in a gene, whereas green indicates no intron contained. (G) Number of tRNAs in 100-kb nonoverlapping windows.

