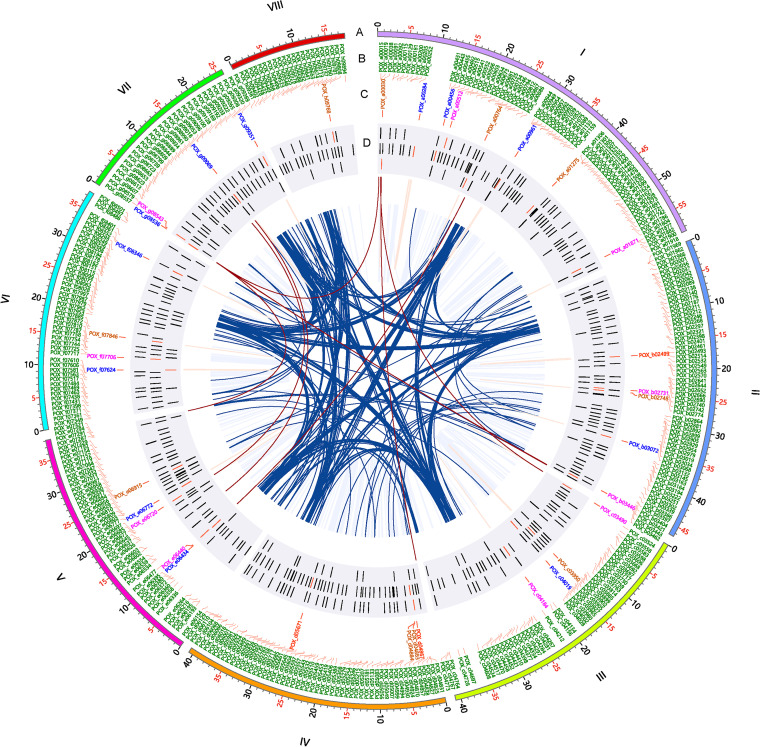
FIG 6.
Circos plot indicating interactions of cellulase and xylanase genes and transcription factor genes in P. oxalicum. (A) Schematic representation of chromosomal size (Mb scale). (B) Names of transcription factor genes. (C) Names of genes encoding cellulase and xylanase. (D) Location of the genes described above. The roman numbers represent the chromosomes. Red gene ID, cellobiohydrolase gene; brown gene ID, endo-β-1,4-glucanase; blue gene ID, β-glucosidase; pink gene ID, endo-β-1,4-xylanase. The brown and dark blue lines represent contacts among enzyme and transcription factor genes.

