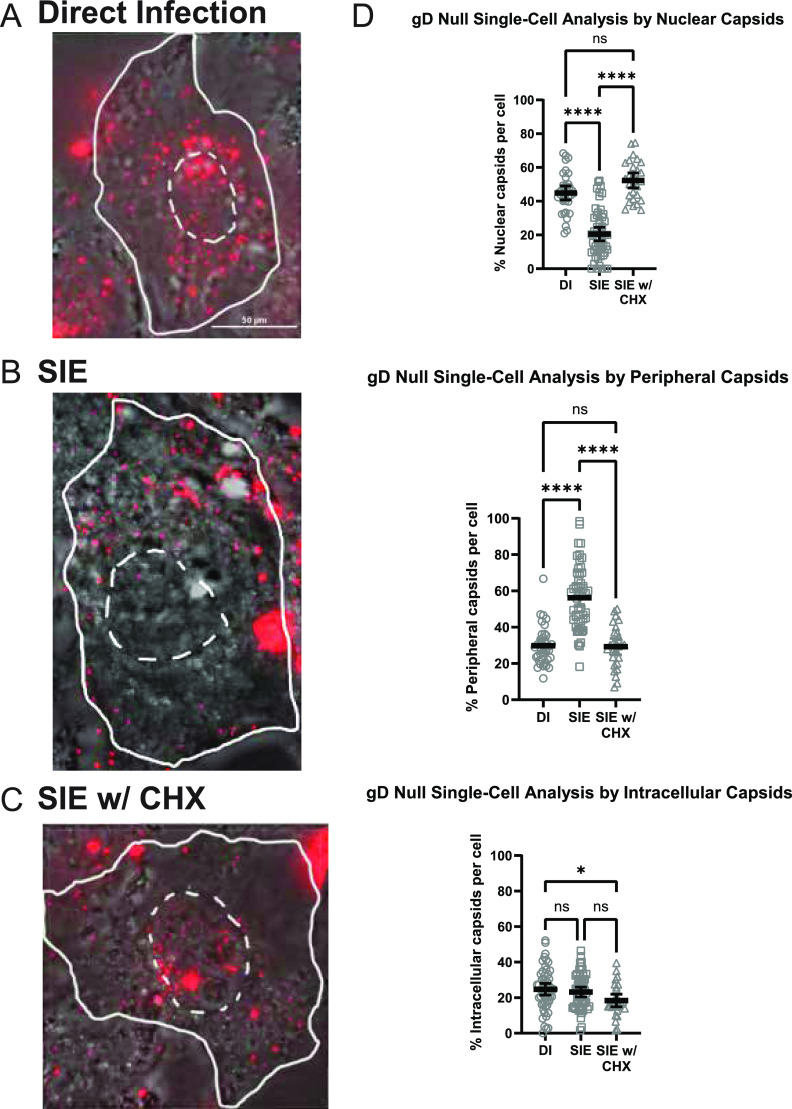
FIG 6.
SIE during gD-null infection also reduces nuclear-associated capsids. Representative images of capsid distribution under three conditions of infection. The dotted white line indicates the nuclear region of the cell, while a solid line depicts the periphery of the PK15 cell. For each condition, a minimum of 3 fields were analyzed and depicted as percentage of total capsids per cell for each category. Quantitative results from single-cell analysis were statistically compared by one-way ANOVA. (A) Direct infection with PRV 180 (MOI 100). (B) SIE infection with primary infection of PRV GS442 (gD-null) and secondary infection of PRV 180. (C) SIE infection with CHX treatment. CHX treatment occurred between infection of primary and secondary. (D) Dunn’s multiple-comparison test (one-way ANOVA) comparing capsid localization between conditions. *, P = 0.0292; ****, P < 0.0001.

