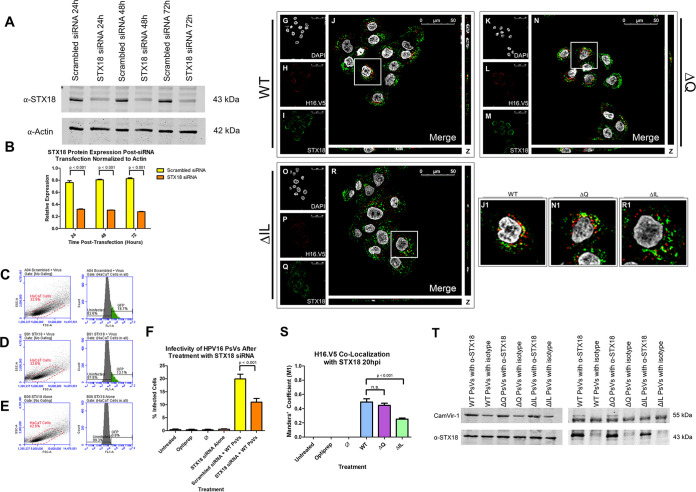
FIG 10.
WT HPV16 PsVs interact with syntaxin 18 20 h postinfection and the interaction is lost in the ΔIL mutant PsVs. (A) Western blot image of syntaxin 18 siRNA 24, 48, and 72 h posttransfection for actin (lower) and syntaxin 18 (upper). HaCaT cells were transfected with either syntaxin 18 siRNA or scrambled siRNA control. (B) Normalization of syntaxin 18 protein levels to actin. Data is the average of three independent samples. Data is represented as mean ± SEM, n = 3. (C–E) Flow cytometry data showing density plot with parent gate selecting HaCaT cells of interest (left) and histogram of cells within parent gate that express GFP (right) for (C) cells transfected with scrambled siRNA and infected with WT PsVs, (D) cells transfected with STX18 siRNA and infected with WT PsVs and (E) cells transfected with STX18 siRNA without infection. (F) Quantification of flow cytometry data for GFP expression. Data is the average of three independent experiments. Data is represented as mean ± SEM, n = 3. (G–R) Cells were seeded onto coverslips and infected with WT (A-D), ΔQ mutant (E-H), or ΔIL mutant (I–L) PsVs for 20 h before immunofluorescence slide preparation and antibody staining for H16.V5 and syntaxin 18 overlap. Representative immunofluorescence images are taken from the center of Z-stack image set. (G, K, O) Nuclei stained with DAPI (gray). (H, L, P) H16.V5 representing L1 (red). (I, M, Q) syntaxin 18 (green). (J, N, R) Merged image of all channels displaying colocalization of H16.V5 and syntaxin 18. (J1, N1, R1) Zoomed images of white square from merged channels. (S) M1 coefficient for H16.V5 overlapping syntaxin 18 at 20 h postinfection for untreated, Optiprep, Ø plasmid preparation, WT PsVs, ΔQ mutant PsVs, and ΔIL mutant PsVs. Data is the average of six independent confocal scans for each condition, each with the Manders’ M1 coefficient of four slices averaged together from the center of the Z-stack. Data is represented as mean ± SEM, n = 6. M1 coefficient was determined using the JACoP plugin for ImageJ. Individual statistical differences determined by Bonferroni’s post-test after significant ANOVA, α = 0.05, df = 5. (T) Western blot image of co-immunoprecipitation for syntaxin 18 and L1 protein (CamVir-1). HaCaT cells were infected with WT, Q mutant, or IL mutant PsVs for 20 h before harvesting in lysis buffer. Samples were incubated with either anti-syntaxin 18 antibody or rabbit IgG isotype. Image displays flow through for samples (LEFT) or eluates (RIGHT).

