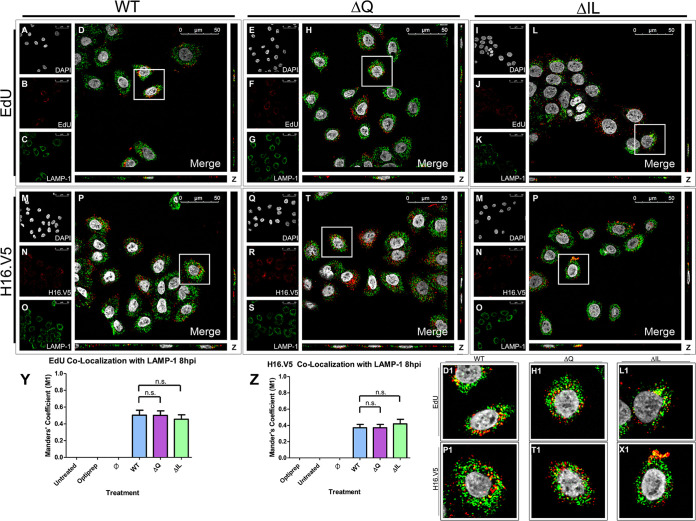
FIG 5.
HPV16 pseudovirions associate with the late endosome 8 hpi. Cells were seeded onto coverslips and infected with WT, ΔQ mutant, or ΔIL mutant PsVs for 8 h before immunofluorescence slide preparation and antibody staining for either EdU and LAMP-1 overlap (A–L) or H16.V5 and LAMP-1 overlap (M–X) Representative immunofluorescence images are taken from the center of Z-stack image set. Top three panels represent EdU and LAMP-1 signal for WT (A-D), ΔQ mutant (E–H), and ΔIL mutant (I–L) PsVs. (A, E, I) Nuclei stained with DAPI (gray). (B, F, J) Pseudogenome expressing EdU (red). (C, G, K) Late endosome stained with LAMP-1 (green). (D, H, L) Merged image of all channels displaying colocalization of pseudogenome and LAMP-1. (D1, H1, L1) Zoomed images of white square from merged channels. Bottom three panels represent H16.V5 and LAMP-1 signal for WT (M-P), ΔQ mutant (Q–T), and ΔIL mutant (U–X) PsVs. (M, Q, U) Nuclei stained with DAPI (gray). (N, R, V) H16.V5 representing HPV16 L1 protein (red). (O, S, W) Late endosome stained with LAMP-1 (green). (P, T, X) Merged image of all channels displaying colocalization of H16.V5 and LAMP-1. (P1, T1, X1) Zoomed images of white square from merged channels. (Y-Z) M1 coefficient for (Y) pseudogenome (EdU) or (Z) H16.V5 overlapping late endosome (LAMP-1) at 8 h postinfection for untreated, Optiprep, Ø plasmid preparation, WT PsVs, ΔQ mutant PsVs, and ΔIL mutant PsVs. Data is the average of six independent confocal scans for each condition, each with the Manders’ M1 coefficient of four slices averaged together from the center of the Z-stack. Data is represented as mean ± SEM, n = 6. M1 coefficient was determined using the JACoP plugin for ImageJ. Individual statistical differences determined by Bonferroni’s post-test after significant ANOVA, α = 0.05, df = 5.

