. 2022 Jun 3;13(25):7482–7491. doi: 10.1039/d2sc02024f

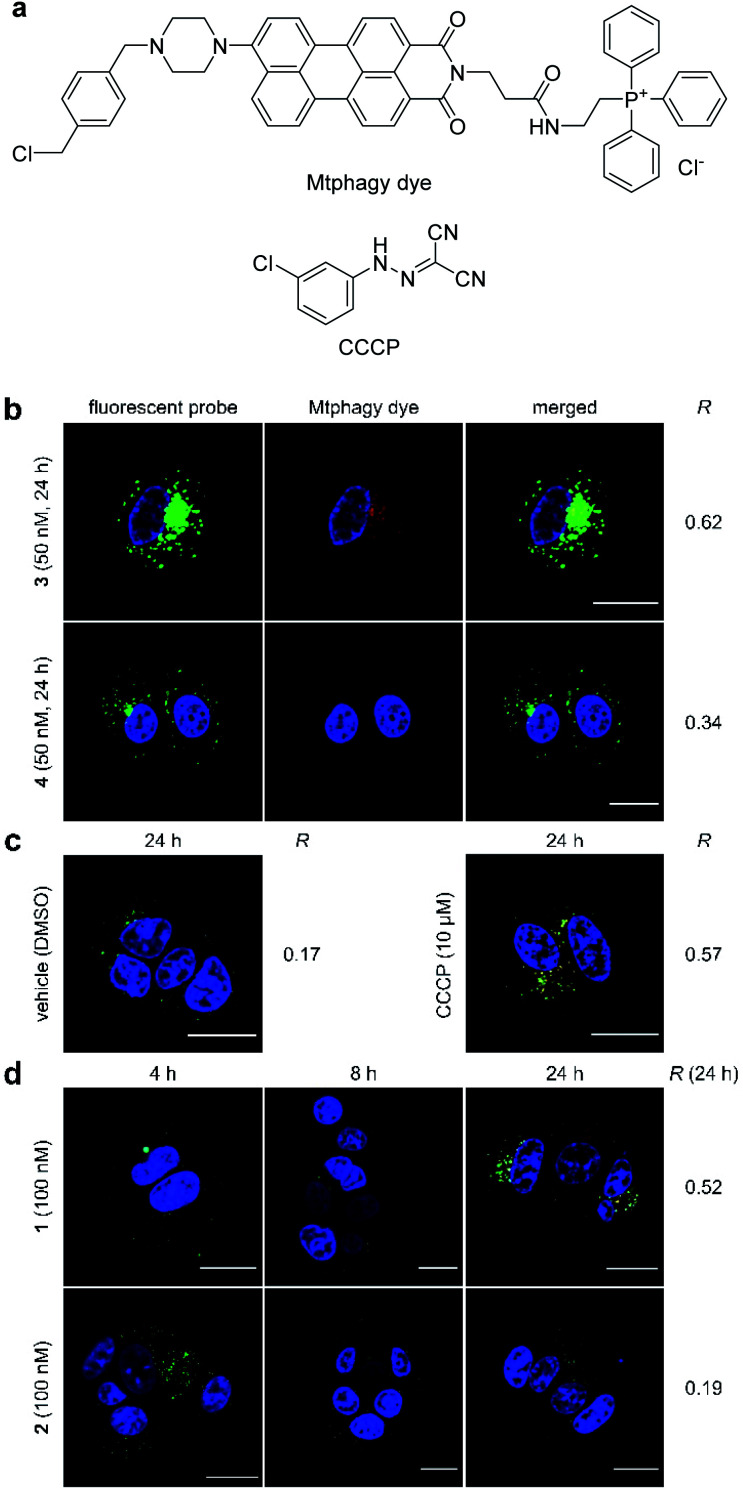
Fig. 4. Mitophagy induced by 1–4. (a) Structures of Mtphagy dye and carbonyl cyanide m-chlorophenylhydrazone (CCCP). (b) Confocal fluorescent images obtained using fluorescent probe 3 or 4 (50 nM) in the presence of Mtphagy dye (red) after 24 h incubation with MCF-7 cells. (c) Confocal fluorescent images obtained using Mtphagy dye (red) and lysosome-selective dye (Lyso dye, green). Vehicle (DMSO) and CCCP (10 μM) were added and incubated for 24 h. (d) Confocal fluorescent images obtained using Mtphagy dye and Lyso dye after incubation with 1 or 2 (100 nM) for 4, 8, and 24 h. Subcellular regions colored in yellow in the images indicate colocalization of the Mtphagy dye and synthetic probes (b) or Lyso dye (c, d). The nuclei were stained with Hoechst 33342. Scale bar represents 20 μm. R value represents Pearson's correlation coefficients calculated from the green and red fluorescence in each merged image.

Fig. 4