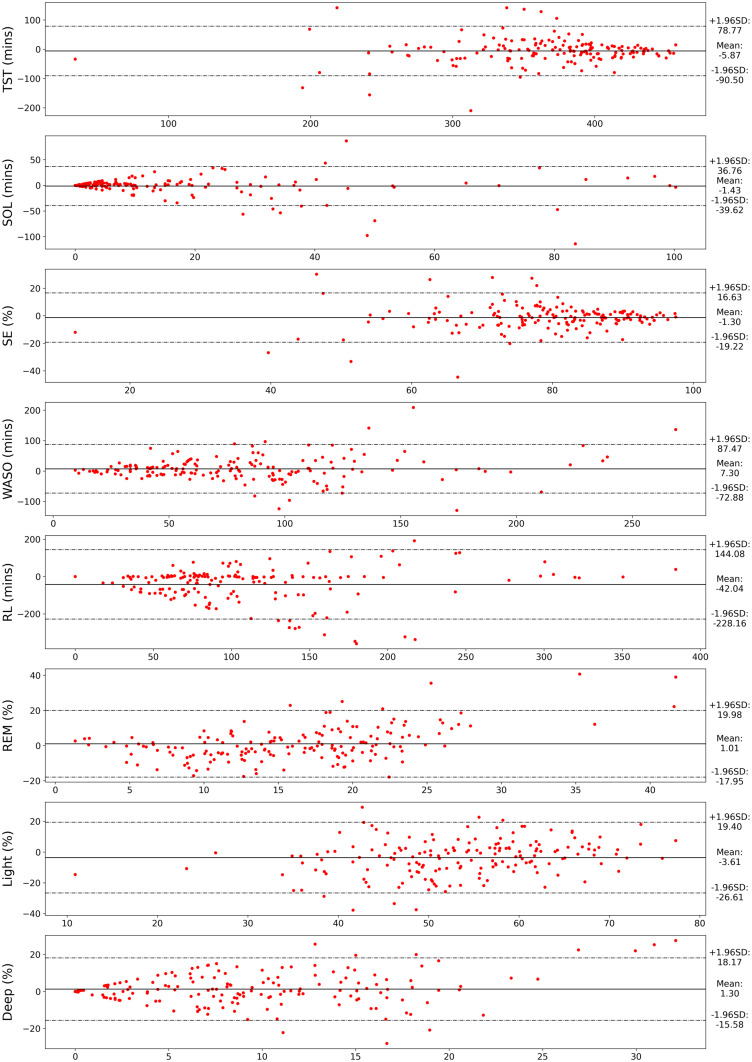
Figure 8.
Bland-Altman plots for common sleep metrics: Total Sleep Time (TST), Sleep Onset Latency (SOL), Sleep Efficiency (SE), Wake After Sleep Onset (WASO), REM Latency (RL), and REM, Light, and Deep percentages. X-axis represents the mean value while Y-axis represents the difference of sleep metric values from SoundSleepNet and the polysomnography (PSG). The dashed lines represent the 95% limit of agreement.

