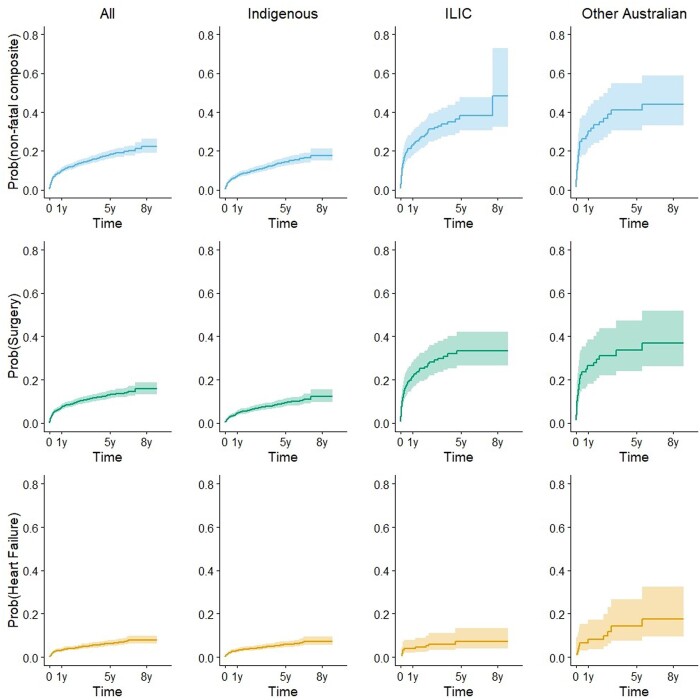
Figure 3.
Progression to secondary outcomes for the study cohort and separately for Indigenous, ILIC, and other Australian population groups is illustrated by cumulative incidence function curves for the composite of all non-fatal complications (top panel, blue), surgical intervention (middle panel, green), and heart failure (bottom panel, orange). Shading indicates 95% confidence intervals.

