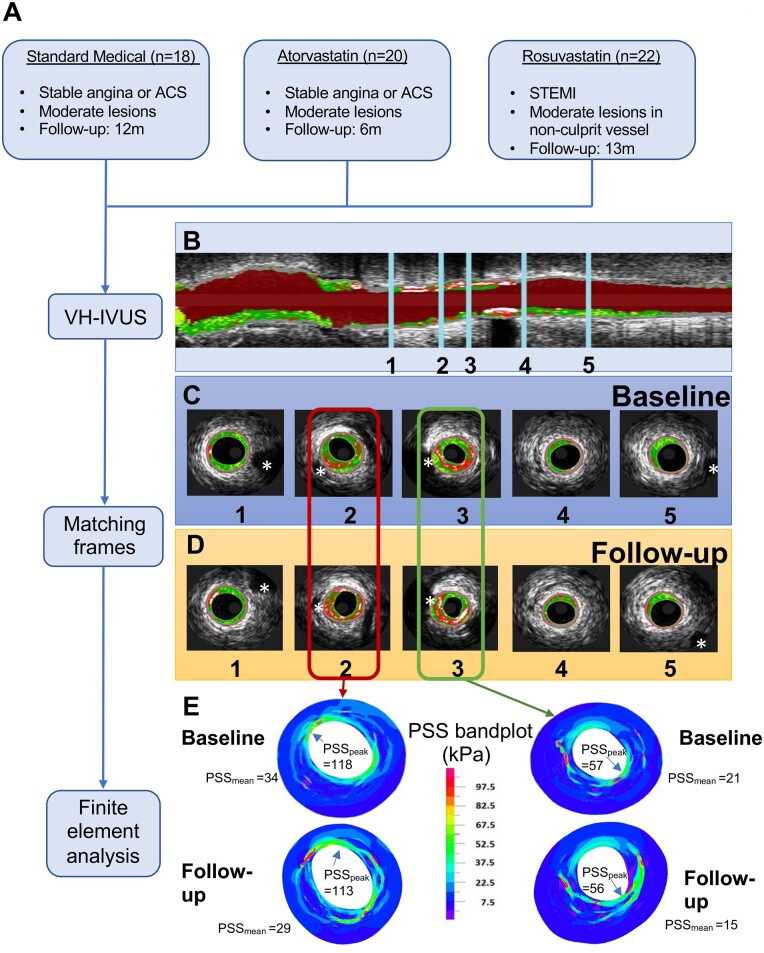
Figure 1.
Study workflow and co-registration of baseline and follow-up virtual-histology intravascular ultrasound images and corresponding plaque structural stress band plots. (A) Flow chart of study workflow. (B) Longitudinal view of virtual-histology intravascular ultrasound pullback with 5 marked points. The segment of interest was defined using the most proximal and distal side branches (marked with *) seen at baseline (C) and follow-up (1, 5) (D). Other side branches (2, 3) or fiduciary marks were used to identify corresponding frames, and an interpolation technique applied to find corresponding frames in segments with no landmarks (4). (E) Examples of peak and mean plaque structural stress (PSSpeak and PSSmean) band plots for marked points 2 and 3 at baseline and follow-up. ACS, acute coronary syndrome; STEMI, ST-segment elevation myocardial infarction.

