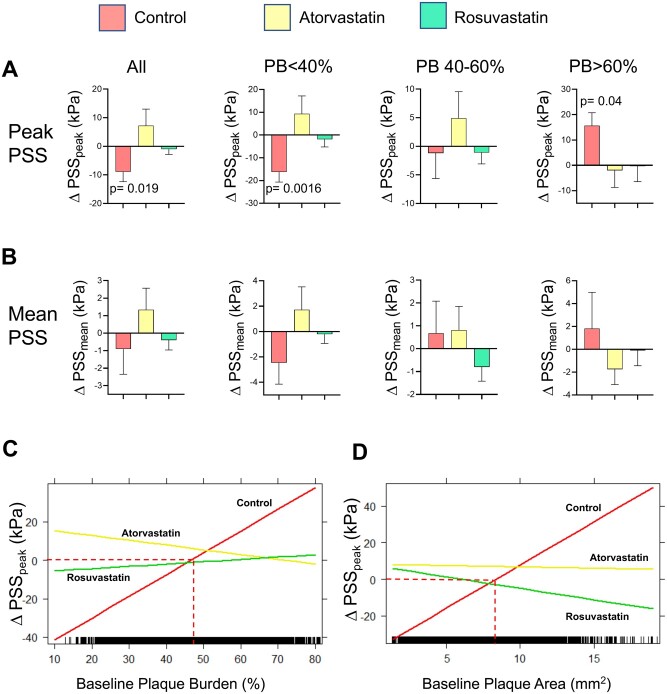
Figure 2.
Changes in peak and mean plaque structural stress with baseline plaque burden after control or high-intensity statin treatment. Change in PSSpeak (A) or PSSmean (B) in all plaques or with different plaque burden in control patients or treated with high-intensity statins. Data are mean (standard error), using mixed-effects models. Interaction plots of linear mixed-effects models showing significant interaction effect of treatment group and baseline plaque burden (C) or plaque area (D) on ΔPSSpeak. PB, plaque burden; PSS, plaque structural stress.

