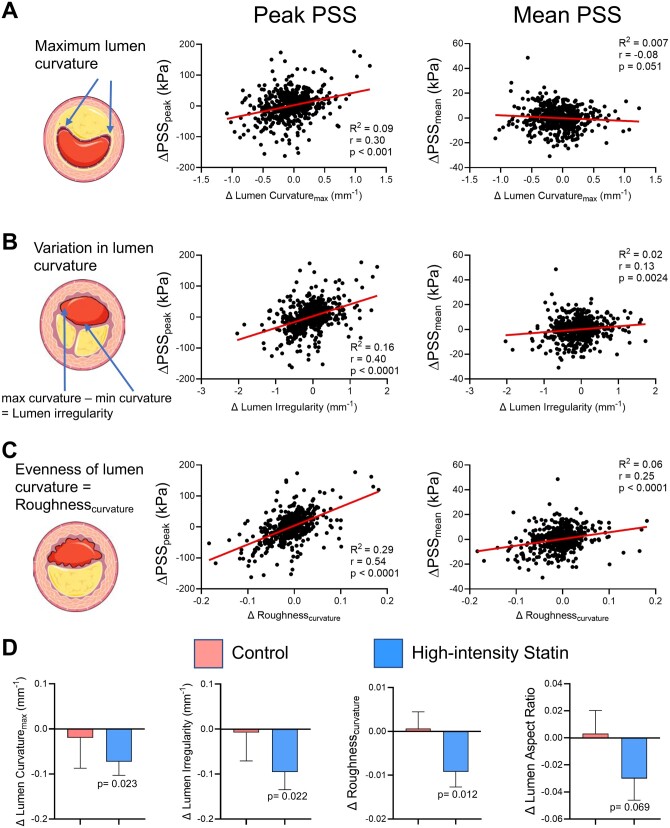
Figure 5.
Lumen parameter analysis in plaques with baseline plaque burden >60%. Linear regression correlation curves for change in peak and mean plaque structural stress, with change in (A) maximum lumen curvature, (B) lumen irregularity, and (C) lumen roughness, in all plaques with baseline plaque burden >60%. (D) Change in lumen curvature, irregularity, roughness, and lumen aspect ratio in control patients or after high-intensity statin treatment. Data are mean (standard error) by plaque-level mixed effect models, total frames = 1112, plaques = 42.

