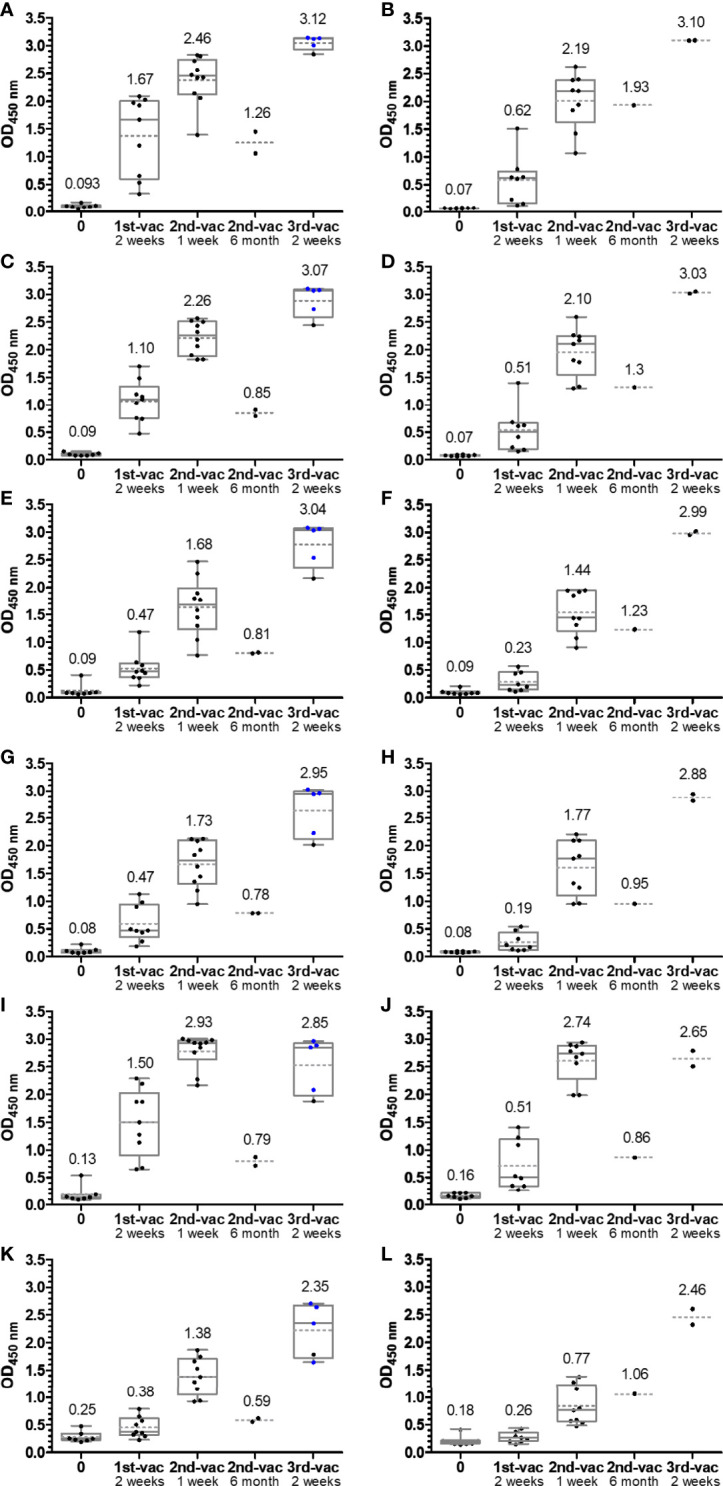
Figure 2.

Box plots of the OD450 values obtained in an anti-RBD IgG ELISA using wild-type (A, B), alpha (C, D), beta (E, F), gamma (G, H), delta (I, J), and omicron RBDs (K, L). Serum or plasma samples were obtained from people vaccinated with mRNA-1273 (left panels A, C, E, G, I, K) or BNT162b2 (right panels B, D, F, H, J, L). Sera collected from people with heterologous booster vaccinations (2× mRNA-1273 and once BNT162b2) are indicated as blue dots. The median values are provided above the boxes and are additionally indicated as gray horizontal lines in the boxes, while the mean values are shown as gray horizontal dotted lines.
