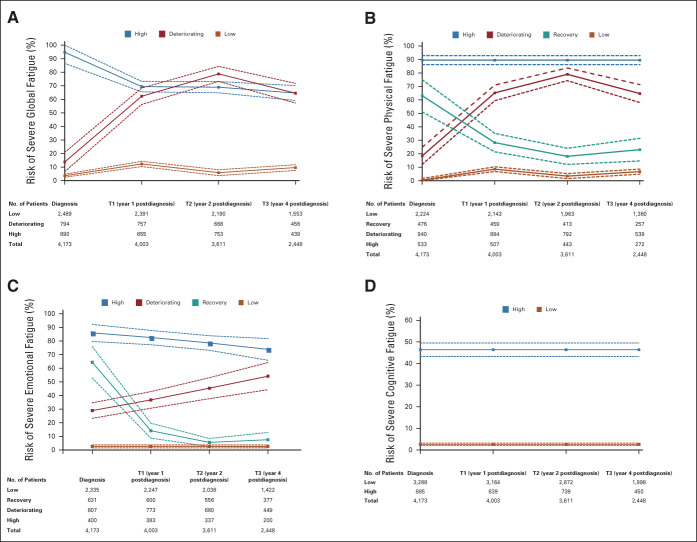
FIG 1.
Trajectory groups according to the best-fitting prediction model of (A) severe global fatigue, (B) severe physical fatigue, (C) severe emotional fatigue, and (D) severe cognitive fatigue. Solid lines represent the predicted trajectories of risk estimate, and dashed lines represent the respective 95% CIs of risk estimate. T, time.

