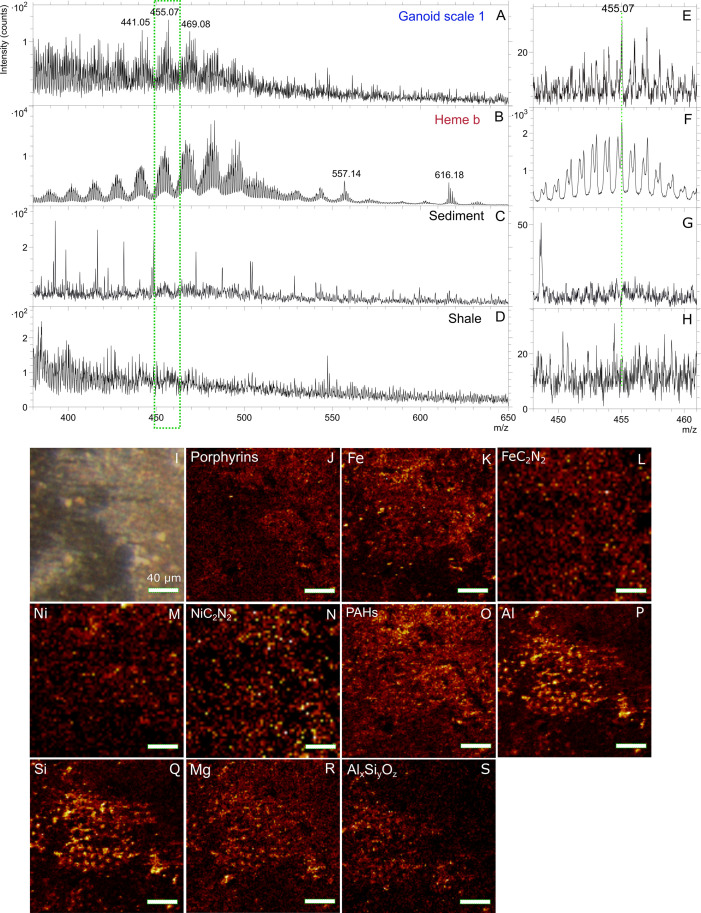
Fig 2. Molecular characterization of gray-brown film on Messel fossil fish scale by ToF-SIMS indicating porphyrins.
Positive ToF-SIMS spectra (m/z 380–650) of A) area indicated by green dotted box on ganoid scale 1 in Fig 1B, B) heme b standard, C) sediment attached to scale (S1 Fig) and D) shale sample collected nearby (S1 Fig). E-H) Zoom-in of green dotted box in spectra in A-D showing m/z 448–461. I) Micrograph of area in green dotted box in Fig 1B. High spatial resolution ToF-SIMS ion images of J) sum of porphyrin peaks (m/z 434–447, 449–461, 462–473 and 474–485), K) Fe+, L) FeC2N2-, M) Ni+, N) NiC2N2-, O) sum of PAH:s (m/z 77, 91, 139, 141 and 165), P) Al+, Q) Si+, R) Mg+ and S) sum of AlSiO4- and AlSi2O6-.

