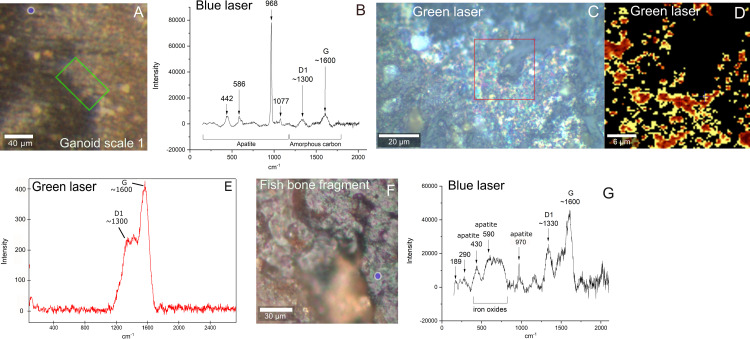
Fig 4. Chemical and mineralogical characterization of Messel fossil scale and bone fragment by Raman.
A) Micrograph of ToF-SIMS area on ganoid scale 1 with gray-brown film (Fig 1A and 1B). B) Blue laser Raman spectrum from blue circle in area of film on fish scale in A. C) Micrograph of area in green square in A where green laser Raman scan was performed. Note that scale is rotated compared with A. D) Raman map of D1 peak of red area in C. E) Summed Raman spectrum of scan in red square in C) indicating refractory carbon. F) Micrograph of ToF-SIMS area on bone fragment (Fig 1E and 1F). Blue circle indicates area of Raman analysis on porphyrin-rich area identified by ToF-SIMS. G) Blue laser Raman spectrum of blue circle on bone fragment in F.

