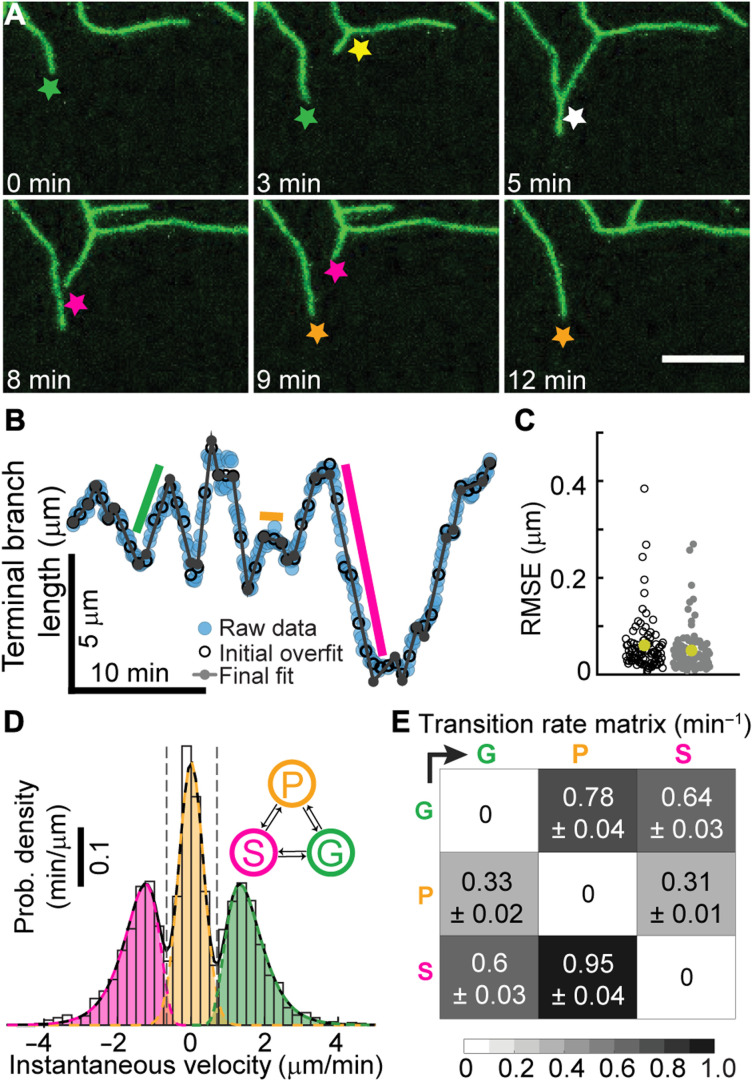
Fig. 3. Dendrite tips transition between growing, shrinking, and paused states.
(A) Class IV dendrites growing (green star), birthing (yellow star), colliding (white star), shrinking (magenta star), and pausing (orange star). Maximum projection spinning disk images of neurons were collected every 5 s for larval stage of 24 hours (genotype ;;ppkCD4-tdGFP). (B) Length of a dendrite as a function of time (see Materials and Methods). The black open circles represent the initial piecewise linear fit using N/6 segments, where N is the total number of frames. The gray dots show the fitting after the iterative merging process (see Materials and Methods). Green, orange, and magenta indicated periods of growth, pausing, and shrinkage, respectively. (C) The root mean square error (RMSE) before (black) and after (gray) merging for 91 trajectories (24 hours). The average error is 50 nm. (D) The velocity distribution shows three distinct peaks representing the growing (G), paused (P), and shrinking (S) states. (E) Transition rates between the three states.

