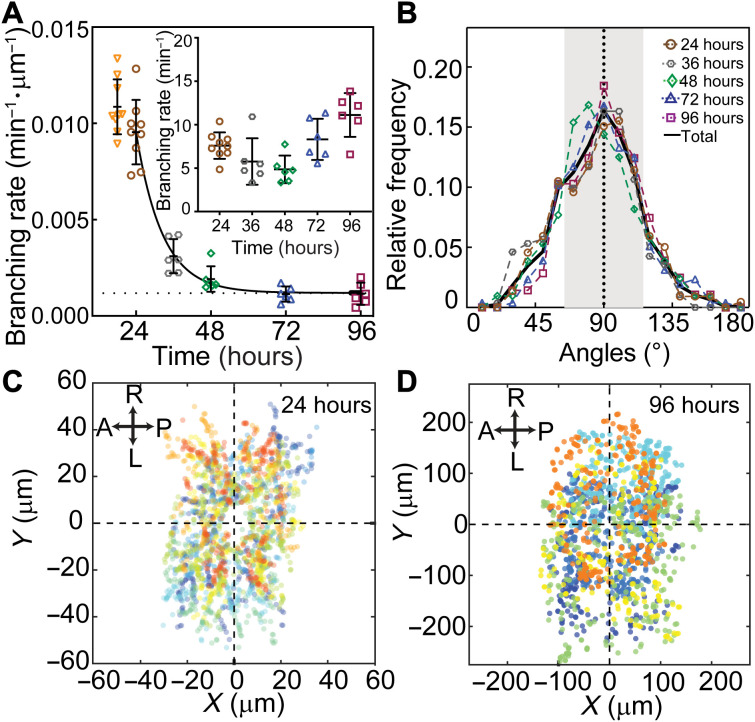
Fig. 4. Dendrite branching over development.
(A) The rate of appearance of new branches normalized by the total branch length is plotted against developmental time. Each symbol represents a neuron from a different larva (except at 24 hours where three neurons in each of the three larvae were analyzed). The curve is an exponential fit with an offset (dotted line). Inset: Total branching rate per cell. (B) Distribution of branch angles between daughters at different developmental stages. The angle is zero when the new daughter grows parallel to the mother. Numbers of neurons are the following: six (24 hours), seven (36 hours), four (48 and 96 hours), and five (72 hours). (C) Spatial distribution of branching events at 24 hours (nine neurons from three larvae). (D) Spatial distribution of branching events in 96 hours (six neurons from six larvae). In both (C) and (D), the soma positions are centered at the origin. Different colors represent different cells.

