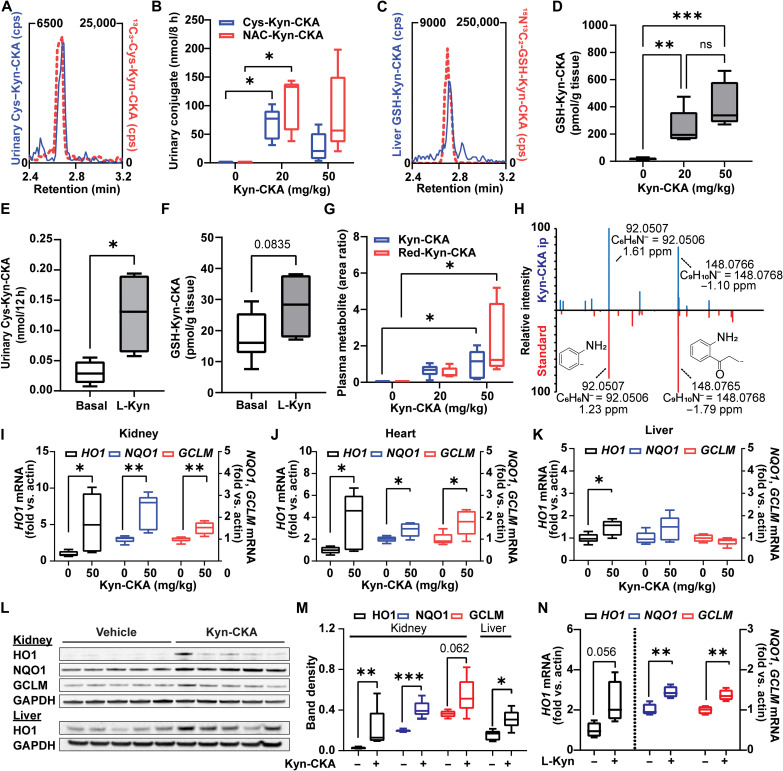
Fig. 2. Kyn-CKA is formed endogenously and induces Nrf2-dependent genes in vivo.
(A) Representative LC-MS/MS trace showing coelution between endogenous urinary Cys-Kyn-CKA and an isotopically labeled synthetic standard. cps, counts per second. (B) Urinary Cys-Kyn-CKA and NAC-Kyn-CKA 8 hours after Kyn-CKA (intraperitoneally) in C57Bl6/J mice (n = 5 per dose). (C) LC-MS/MS trace of endogenous GSH-Kyn-CKA in the untreated mouse liver coeluting with an isotopically labeled synthetic standard. (D) Hepatic GSH-Kyn-CKA in mice 8 hours following Kyn-CKA (basal, n = 9; n = 5 per dose). (E) Urinary Cys-Kyn-CKA in mice receiving L-Kyn (50 mg/kg/day, ip, two doses, 24 hours apart n = 4). (F) Hepatic GSH-Kyn-CKA L-Kyn–treated mice (50 mg/kg/day, ip, two doses, 24 hours apart; basal, n = 9; L-Kyn, n = 4). (G) Plasma Kyn-CKA metabolites 8 hours after dosing. (H) Red-Kyn-CKA MS/MS spectra for Kyn-CKA–treated plasma (20 mg/kg, above) and synthetic Red-Kyn-CKA (below). (I to K) Nrf2-dependent gene expression in mice 8 hours after Kyn-CKA (50 mg/kg; n = 5 per dose). (L and M) Nrf2-dependent protein levels in mice 24 hours after Kyn-CKA (25 mg/kg, ip, two doses, 8 hours apart). (N) Nrf2-dependent gene expression in the mouse liver 12 hours after second L-Kyn dose (50 mg/kg, ip, two doses, 24 hours apart; n = 4). *P < 0.05, **P < 0.01, and ***P < 0.0001 by one-way ANOVA and Tukey’s test (B, D, and G) or t test (E, F, and I to N). Kidney HO1 in (M) was analyzed by Mann-Whitney test.

