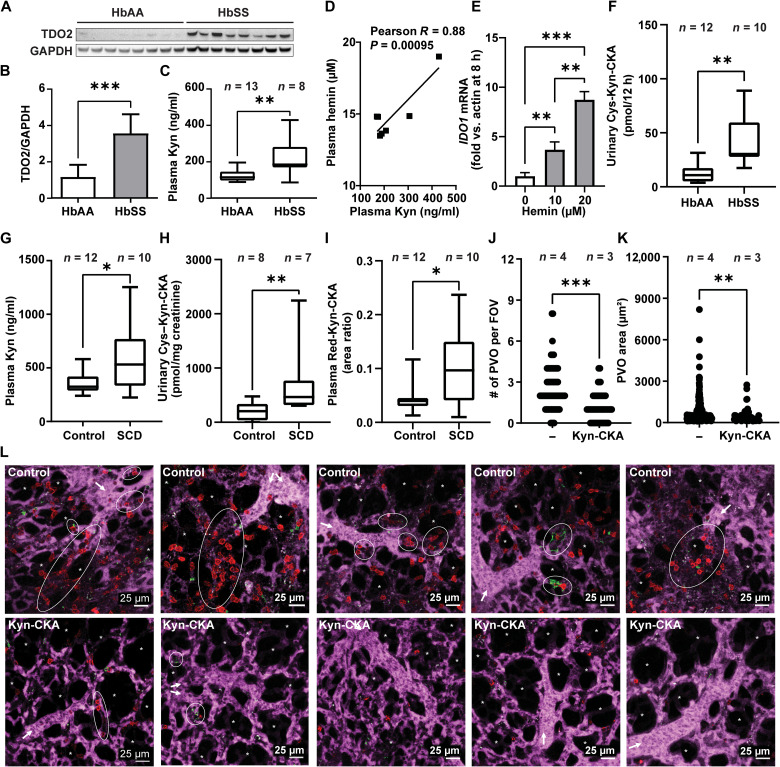
Fig. 5. Kyn-CKA synthesis is elevated in SCD and attenuates pulmonary microvascular occlusion.
(A and B) TDO2 immunoblot and quantification (n = 8 per genotype). (C) Plasma kynurenine in HbAA versus HbSS mice. (D) Correlation between HbSS plasma kynurenine and hemin (n = 7). (E) IDO1 induction by hemin in J774a.1 (n = 3 per condition). (F). Cys-Kyn-CKA in 12 hours HbAA and HbSS urine. (G to I) Plasma kynurenine, urinary Cys-Kyn-CKA, and plasma Red-Kyn-CKA in healthy and SCD volunteers. (J and K) Number of pulmonary vaso-occlusions (PVO) per field of view (FOV) and pulmonary vaso-occlusion area in HbSS mice receiving phosphate-buffered saline (PBS) or Kyn-CKA (10 mg/kg, iv) 30 min before LPS (0.1 μg/kg, iv). Control, n = 4 (89 FOVs); Kyn-CKA, n = 3 (60 FOVs). (L) Representative FOVs for HbSS mice treated as in (K). Asterisks denote alveolar spaces, arrows indicate blood flow direction, and ellipses show pulmonary vaso-occlusions. Scale bars, 25 μm. *P < 0.05, **P < 0.01, ***P < 0.0001 by t test (B, C, G, and I), Mann-Whitney test (F, H, J, and K), or one-way ANOVA and Tukey’s test (E).

